Seller Profit Guard · How it works · CSV privacy
Return and refund loss calculator
Expected return loss per original order equals the mature return rate multiplied by lost outbound shipping, return shipping, handling, and unrecovered product value. This calculator separates incident severity from frequency, subtracts the expected loss from contribution before returns, and estimates the highest return rate compatible with an editable target margin.
Maintained by Seller Profit Guard Editorial Team. Last reviewed: 2026-07-25.
What does the return-window loss calculator measure?
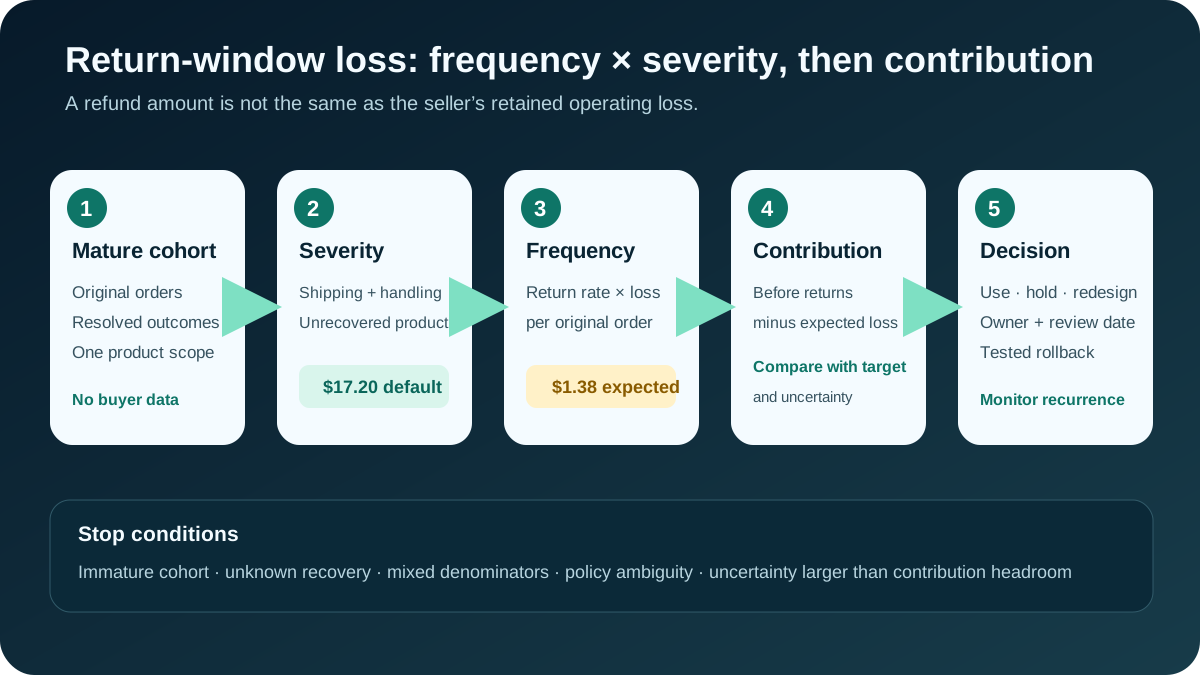
The calculator estimates the probability-weighted operating cost of mature returns for one product or defensible product group. It does not treat the buyer's refund amount as the seller's loss. Instead, it models costs that can remain after an incident: lost outbound shipping, return shipping, inspection or support work, and the part of product cost that is not recovered through resale.
The primary output is expected return loss per original order. That grain matters. A $17.20 loss on a returned order at an 8% return rate creates an expected drag of $1.376 across each original order in the cohort, displayed as $1.38. The tool then subtracts that expected drag from contribution before returns and compares the result with a chosen target margin.
This is a planning model, not a refund workflow, return-policy recommendation, accounting profit statement, tax opinion, legal conclusion, case forecast, or promise of Purchase Protection coverage. Use current Etsy rules for policy actions and mature seller records for economic inputs. Segment materially different products, markets, fulfillment paths, and return outcomes.
- Use original orders as the return-rate denominator.
- Include only resolved outcomes after the declared return window.
- Separate refund cash, fee credits, shipping, handling, and recovery.
- Recalculate after policy, product, packaging, carrier, or fee changes.
The exact return-loss formulas and ten inputs
Let P be sale price, C product cost, F fulfillment cost, f the combined percentage fee rate, q the mature return rate, O lost outbound shipping, R return shipping, H return handling or support cost, s resale recovery rate, and m target margin. Unrecovered product value is C × (1 − s). Loss per returned order is L = O + R + H + C × (1 − s). Expected loss per original order is E = qL.
Contribution before returns is B = P − C − F − fP. Adjusted contribution is A = B − E, and adjusted contribution margin is A ÷ P when price is positive. The target-safe return-rate ceiling is qmax = (B − mP) ÷ L when L is positive. If the product misses the target before return loss, the displayed operating ceiling cannot safely be positive.
The model intentionally keeps fulfillment cost outside incident severity. Fulfillment represents a normal non-return cost already incurred on every modeled sale. Lost outbound shipping is an incident input only when that shipping amount is not already inside fulfillment or recovered elsewhere. Map every dollar to one line to prevent double counting.
| Symbol | Input | Calculation role | Evidence |
|---|---|---|---|
| P | Sale price | Revenue and target base | Resolved paid order value at the chosen grain |
| C | Product cost | Normal cost and recovery base | Versioned product or SKU cost |
| F | Fulfillment cost | Normal non-return cost | Packaging, handling, and outbound fulfillment scope |
| f | Percentage fee | Contribution before returns | Current policy plus reconciled account rows |
| q | Mature return rate | Incident frequency | Resolved returns divided by original orders |
| O + R + H | Return incident costs | Severity before product recovery | Labels, adjustments, time, and handling records |
| s | Resale recovery | Recovered product-value share | Completed resale, markdown, repair, or write-off outcome |
| m | Target margin | Decision threshold | Documented seller planning assumption |
Default example: $1.38 expected loss per order
The public dummy fixture uses a $38 sale price, $13 product cost, $5.50 fulfillment cost, 8.5% fee assumption, 8% return rate, $4.50 lost outbound shipping, $5 return shipping, $2.50 restock or support cost, 60% resale recovery, and a 20% target margin. At 60% recovery, unrecovered product value is $13 × 40% = $5.20.
Loss per returned order is $4.50 + $5 + $2.50 + $5.20 = $17.20. Multiply by the 8% mature return rate: expected return loss is $17.20 × 0.08 = $1.376 per original order, displayed as $1.38. This value is not the expected refund and should not be compared directly with gross sales without the contribution scope.
Percentage fees are $38 × 8.5% = $3.23. Contribution before returns is $38 − $13 − $5.50 − $3.23 = $16.27. Adjusted contribution is $16.27 − $1.376 = $14.894, displayed as $14.89, or about 39.2% of sale price. At a 20% target, the target-safe mature return-rate ceiling is ($16.27 − $7.60) ÷ $17.20 = 50.4%.
| Step | Formula | Default result |
|---|---|---|
| Unrecovered product | $13 × (1 − 60%) | $5.20 |
| Loss per returned order | $4.50 + $5 + $2.50 + $5.20 | $17.20 |
| Expected loss per original order | $17.20 × 8% | $1.376 → $1.38 |
| Contribution before returns | $38 − $13 − $5.50 − $3.23 | $16.27 |
| Adjusted contribution | $16.27 − $1.376 | $14.894 → $14.89 |
| Target-safe return-rate ceiling | ($16.27 − $7.60) ÷ $17.20 | 50.4% |
Second scenario: lower recovery and higher return frequency
Consider a $30 sale with $12 product cost, $5 fulfillment, a 9% fee assumption, an 18% mature return rate, $5 lost outbound shipping, $6 return shipping, $3 handling, 40% resale recovery, and a 20% target margin. Unrecovered product value is $12 × 60% = $7.20, so incident loss is $5 + $6 + $3 + $7.20 = $21.20.
Expected return loss is $21.20 × 18% = $3.816, displayed as $3.82. Contribution before returns is $30 − $12 − $5 − $2.70 = $10.30. Adjusted contribution is $6.484, displayed as $6.48, or about 21.6%. The target-safe return-rate ceiling is ($10.30 − $6) ÷ $21.20 = 20.3%.
The scenario passes the 20% target by only about 1.6 percentage points of adjusted margin and 2.3 percentage points of return-rate headroom. That is thinner than the default case and may be smaller than uncertainty in recovery, label adjustments, or cohort maturity. A narrow arithmetic pass should be classified as monitor or hold until adverse cases and evidence variance are understood.
- Representative case: current resolved outcome mix.
- Low-recovery case: damaged, customized, seasonal, or obsolete stock.
- High-shipping case: distant return, heavier parcel, or carrier adjustment.
- Policy-change case: new window, eligibility, or seller-funded responsibility.
Build a mature return-rate cohort
Return rate should use original orders whose relevant return window and resolution period have matured. A recent order with time remaining is not evidence of a no-return outcome. Define the sales period, policy window, delivery allowance, case-resolution allowance, and recovery-completion cutoff. Keep unresolved orders visible rather than forcing them into the successful denominator.
Count each original order once and classify each mature outcome once. Separate standard returns, exchanges, replacements, cancellations, lost parcels, damage, seller-funded refunds, platform-covered outcomes, and unresolved cases. If order-level and item-level rates differ materially, choose the grain that matches the calculator's product-cost and incident-cost inputs.
A shop-wide rate can hide the product behavior that matters. Apparel sizing, fragile ceramics, digital goods, personalized products, seasonal inventory, and international shipments can have different policy and recovery paths. Use a product or defensible group when the sample is sufficient; otherwise label the rate provisional and stress-test a range.
| Cohort state | Include in mature rate? | Reason |
|---|---|---|
| Window closed and outcome resolved | Yes | Frequency and severity can be classified |
| Window open | No | Return opportunity is still active |
| Return received but recovery unfinished | Frequency yes; severity provisional | Resale or write-off remains unknown |
| Case or carrier claim unresolved | Keep separate | Responsibility and recovery are not final |
| Canceled before fulfillment | Separate cohort | Economics differ from a physical return |
Measure product recovery instead of guessing it
Resale recovery is the portion of product cost economically recovered after the returned item is inspected and processed. A completed full-price resale may support high recovery. Markdown, repair, repackaging, missing components, contamination, personalization, seasonality, and write-off reduce it. “Returned to inventory” is not proof of recovery until the item has an observed disposition or a controlled valuation rule.
Use outcome classes before blending. For example, separate full-price restock, markdown resale, repair then resale, component salvage, donation, and write-off. Multiply each class's observed net recovery by its mature frequency, then document the weighted assumption. A single optimistic recovery rate can conceal a small but costly unsellable segment.
Do not subtract the buyer refund again inside recovery. Product recovery concerns cost value, while refund and fee credits belong to cash reconciliation. Keep currency, tax basis, effective date, labor treatment, and post-return selling costs explicit. If recovery remains unknown, run zero or conservative recovery as an adverse case.
- Observe completed disposition, not intended relisting.
- Deduct repair, repackaging, markdown, and resale costs consistently.
- Segment personalized, damaged, and seasonal items.
- Treat unknown recovery as uncertainty, not as 100%.
Refunds, cancellations, returns, and protection are different
Etsy's current seller help states that sellers set their own return, exchange, and refund policies, and that a return policy is required when editing or creating a physical-item listing even if returns are not accepted. Agreements made with a buyer through Etsy Messages or the case system must be fulfilled. Use the current official page for policy action; the calculator does not decide whether a return is required.
A refund does not automatically cancel an order. Etsy's cancellation guidance describes separate cancellation steps and says related listing and transaction fees are credited for canceled sales; it also describes transaction and processing fee credits for refunds made through Shop Manager. Reconcile the actual Payment Account rows because timing, payment method, partial refunds, shipping labels, and other charges can differ.
Etsy Purchase Protection is conditional, not an assumed recovery input. Current official guidance describes qualifying circumstances and coverage boundaries, including an amount limit and case-date distinctions. Do not set shipping loss or refund responsibility to zero merely because a case might qualify. Classify resolved platform-covered outcomes separately and recheck current rules before a policy or financial decision.
| Event | Primary evidence | Do not infer |
|---|---|---|
| Refund | Refund record and Payment Account credits | Automatic cancellation or full cost recovery |
| Cancellation | Cancellation status and final account rows | Product recovery or unused-label refund |
| Physical return | Agreement, label, receipt, inspection, disposition | Resale value before completed recovery |
| Replacement | Second product and fulfillment evidence | Same severity as a returned resellable item |
| Protection outcome | Resolved case and current policy | Guaranteed coverage for future incidents |
Source every cost at the correct grain
Use a versioned SKU or product cost for product value. Use actual outbound and return labels, adjustments, insurance, and claims for shipping. Use a defined handling rate for inspection, support, cleaning, repair, repackaging, and restocking. Use current official fee policy to identify possible charges, then confirm fee credits and retained costs from resolved account evidence.
Avoid double counting. If normal fulfillment includes outbound postage, do not also label the same amount lost outbound shipping unless the normal contribution and incident equations intentionally require separate treatment. If handling labor is already inside product or fulfillment cost, do not add it again as return processing. Record inclusion and exclusion notes beside every input.
Match period, currency, market, product cohort, tax basis, and effective dates. A file checksum proves only that bytes did not change. It does not prove correct header mapping, outcome classification, or representativeness. Preserve a public dummy fixture and reperform it by hand whenever the calculator, source mapping, or policy model changes.
- Prefer resolved labels and adjustments over quoted rates.
- Separate fixed and percentage fees and record their revenue base.
- Keep normal-order cost and incident-only cost distinct.
- Version assumptions when the source is provisional.
Privacy and local-first analysis
The calculator needs ten aggregate numeric inputs. It does not need buyer names, email addresses, phone numbers, postal addresses, order IDs, tracking numbers, private messages, personalization, payment credentials, medical context, or case narratives. Return reasons can reveal sensitive personal information; reduce them to operational categories before analysis.
Seller Profit Guard performs the quick calculation in the browser and does not require an Etsy login. If evidence begins in a private export, aggregate it locally and keep the original outside the active website directory. Use dummy products and non-reversible fingerprints in screenshots, reports, tickets, email drafts, or community content.
Return rates, defect patterns, supplier costs, recovery values, policy exceptions, and planned changes remain commercially sensitive after buyer data is removed. Store detailed worksheets in controlled storage and limit retention. Do not send raw rows to analytics events. Public pages should use rounded fictional examples such as the fixtures on this page.
- Exclude buyer identity and free-text messages.
- Keep private exports out of source control and public support channels.
- Aggregate mature outcomes at the minimum useful grain.
- Protect seller cost, defect, and recovery strategy.
Validation and boundary cases
The public default must reproduce $17.20 loss per returned order, $1.38 expected loss per original order, $16.27 contribution before returns, $14.89 adjusted contribution, 39.2% adjusted margin, and a 50.4% target-safe return rate. The second fixture must reproduce $21.20 severity, $3.82 expected loss, $6.48 adjusted contribution, and a 20.3% ceiling.
Percentage inputs are bounded for calculation but invalid raw values remain visible as issues. A 180% entered return rate is calculated at 100%, and a negative recovery value is calculated at zero; with the default dollar inputs that produces a $25.00 expected loss. The visible warnings are essential because a bounded numeric result does not make the entered assumption valid.
Test zero return rate, zero incident severity, zero sale price, negative costs, return rate above the target-safe ceiling, contribution below zero, and contribution below target. When incident loss is zero, the return-rate ceiling is labeled no return loss instead of dividing by zero. Stop on an unexpected fixture result.
| Fixture | Expected behavior | Control purpose |
|---|---|---|
| Default | $1.38 expected loss | Regression baseline |
| 180% return, −20% recovery | $25.00 plus two bound warnings | Raw-input validation |
| Zero incident severity | No return-loss ceiling | Division-by-zero boundary |
| Adjusted contribution below zero | Break-even issue | Economic stop |
| Return rate above safe ceiling | Target-rate issue | Decision boundary |
A reversible weekly operating routine
Preserve the previous source package, calculation version, policy snapshot, accepted outputs, decision, and rollback reference. Refresh only mature outcomes. Reconcile counts, unresolved cases, fee credits, labels, handling, and recovery classifications. Run the default and boundary fixtures before loading a new aggregate scenario.
Compare representative, adverse, and prior-version results. Separate movement caused by frequency from movement caused by severity. Assign each proposed response to a root cause: product-page clarity, sizing, packaging, quality control, carrier, handling, policy wording, product design, or offer scope. Do not narrow a return policy merely to make the metric look better without legal and marketplace review.
Record the owner, reviewer, approved action, effective date, stop rule, monitoring window, and tested restoration. After a change, wait for a mature comparable cohort before attributing an effect. Monitor recurrence, unresolved share, outcome mix, incident severity, adjusted contribution, and the distance between the observed rate and target-safe ceiling.
- Freeze prior sources, outputs, decision, and restoration reference.
- Close the mature cohort and keep unresolved outcomes separate.
- Refresh ten inputs from traceable aggregate evidence.
- Run default, boundary, representative, adverse, and prior-version fixtures.
- Classify the driver and approve one reversible response.
- Measure a mature comparable cohort and rollback on the stop rule.
How to interpret the outputs and uncertainty
Loss per returned order is incident severity. Expected loss per original order is severity multiplied by mature frequency. Contribution before returns excludes that expected drag. Adjusted contribution includes it. The maximum return rate at target is a modeled ceiling, not a recommended policy allowance or forecast.
Compare headroom with uncertainty. If the observed return rate is 18% and the target-safe ceiling is 20.3%, the 2.3-point gap may be smaller than sampling error or classification drift. If recovery can move from 40% to zero, severity can change materially even when return frequency is stable. Publish the exact assumptions beside any decision.
Use a three-state contract. Use the result when the cohort is mature, mapping is reproducible, costs are current, fixtures pass, and headroom exceeds plausible uncertainty. Hold when outcomes, recovery, policy scope, or fee credits remain unresolved. Escalate when the decision crosses legal, tax, accounting, consumer-protection, or marketplace-policy boundaries.
- Frequency and severity require different operational responses.
- A positive adjusted contribution can still miss the chosen target.
- A target-safe ceiling is not proof that the policy is appropriate.
- Short-term conversion or revenue movement does not prove return-policy causation.
Audit checklist, limitations, and next actions
A defensible audit records product and market scope, original-order denominator, maturity cutoff, policy version, unresolved count, outcome classes, ten input sources, units, currency, effective dates, formula version, default and boundary fixtures, representative and adverse results, uncertainty, owner, reviewer, decision, release evidence, monitoring window, and rollback. Checked boxes without reproducible evidence do not prove closure.
Use the ten linked guides for formula inputs, a complete example, an unsellable scenario, common mistakes, data sources, decision thresholds, scenario comparison, operating routine, interpretation, and a reusable audit template. Each page serves a distinct task and returns to this calculator. They supplement rather than replace current Etsy documentation and seller records.
The calculator does not connect to Etsy, change a policy, issue a refund, cancel an order, buy a label, determine Purchase Protection eligibility, calculate tax or accounting profit, value inventory, or predict buyer behavior. Its narrow value is transparent: turn one mature frequency estimate and one scoped severity model into expected contribution drag. Verify current official rules and seek qualified advice when a decision exceeds that scope.
- Recheck official Etsy policy immediately before material action.
- Keep unresolved outcomes and unknown recovery visible.
- Require fresh fixtures and a bounded rerun after changes.
- Protect buyer data and commercially sensitive seller evidence.
Sources and further reading
- Etsy Help: Refunds, Returns, and Exchanges for Sellers: Current official guidance on seller return policies, return agreements, replacements, Purchase Protection boundaries, and regional responsibilities.
- Etsy Help: How to Cancel a Sale: Official refund, cancellation, fee-credit, return coordination, and shipping-label workflow.
- Etsy Fees & Payments Policy: Current transaction, payment-processing, advertising, shipping-label, regulatory, and other seller fee scope.
- Etsy Seller Policy: Current seller obligations, privacy, transaction, case, and region-specific responsibility boundaries.
- Seller Profit Guard calculation methodology: Contribution definitions, evidence hierarchy, editable assumptions, local-first privacy, uncertainty, and non-advice limits.
Related Seller Profit Guard tools
- Etsy CSV profit calculator: Run a local order profit check with editable fee and SKU cost assumptions.
- Payment reconciliation tool: Compare order rows with statement activity and flag unmatched rows.
- SKU cost library: Save or import material, labor, packaging, shipping, and target margin assumptions.
- Variant risk checker: Find missing SKUs and variation cost risks before a listing scales.
- Etsy title checker: Review listing-title clarity, repetition, keyword chains, and mobile scanning.
- Etsy tag checker: Review all 13 tag slots for duplicates, repeated meaning, and truthful coverage.
- Free shipping threshold calculator: Estimate when a shipping subsidy can still meet a target margin.
- Return window loss estimator: Model expected reverse shipping, restock work, recovery, and replacement loss.
- Etsy Ads break-even calculator: Estimate target-safe Etsy Ads spend, ACOS, and ROAS after fees, fulfillment, and expected return loss.
- CSV data privacy: Understand what the local-first workflow needs and what it does not need.
- Return Loss Formula: 10 Inputs Explained: Calculate expected return loss per order from ten scoped inputs, distinguish refund cash from retained cost, and derive a target-safe return rate.
- Return Loss Example: Resellable Item: Follow a complete resellable-return example from contribution and recovery through expected loss, adjusted margin, and a target-safe return rate.
- Return Loss for an Unsellable Item: Model an unsellable return with zero product recovery, higher handling, and seller-funded shipping without reusing a resellable-item average.
- 12 Return Loss Calculator Mistakes: Fix twelve return-loss errors involving denominators, fee credits, recovery, shipping, cohorts, policy scope, timing, and false precision.
- Return Loss Data: 8 Reliable Sources: Map every return-loss input to first-party seller records, Etsy policy, shipping evidence, recovery outcomes, and privacy-safe aggregates.
- Set a Safe Return Loss Threshold: Separate break-even, target, stress, evidence, and rollback thresholds for return loss without turning a model into a universal benchmark.
- Resellable vs Unsellable Return Loss: Compare resellable and unsellable returns at the same order grain to isolate recovery, handling, shipping, and frequency drivers.
- Weekly Return Loss Review in 45 Minutes: Run a weekly evidence-preserving return-loss review across mature cohorts, costs, recovery, decisions, exceptions, and rollback.
- Interpret Return Loss Without False Precision: Read expected loss, incident severity, adjusted contribution, margin, safe return rate, score, uncertainty, and next action responsibly.
- Return Loss Audit Checklist and Log: Audit cohort scope, ten inputs, source maturity, calculations, privacy, policy boundaries, fixtures, approval, feedback, and rollback.
Use the interactive tool
Enable JavaScript to open the calculator and process browser-local inputs. The explanatory content and source links remain available without JavaScript.
Related guide: Read the refund and fee impact guide.
This tool provides operating estimates, not tax, accounting, legal, financial, or marketplace-policy advice. Verify current official sources and your own records before changing prices or operations.