Where to get reliable return window loss data
Last updated: 2026-07-29
Written and reviewed by Seller Profit Guard Editorial Team.
Reliable return-loss inputs come from mature product-level return cohorts, SKU cost records, fulfillment records, actual outbound and return labels, support or restock time logs, completed resale or write-off outcomes, reconciled fee credits, and current marketplace policy. Keep buyer identity out and label every estimate, exclusion, and source date.

Which source belongs to each calculator input?
Sale price and fee evidence come from reconciled completed order and Payment Account records. Product cost comes from the SKU or batch cost library. Fulfillment cost comes from pick-pack, ordinary packaging, and ordinary shipment preparation at the same order grain. Return rate comes from mature product-level outcomes, not open cases or a dashboard screenshot without scope.
Lost outbound shipping and return shipping come from actual labels, adjustments, credits, insurance, and buyer-responsibility records. Restock or support cost comes from a measured workflow: communication, label administration, inspection, cleaning, repair, repackaging, disposal, and inventory update. Recovery comes from completed resale, markdown, repair, salvage, or write-off outcomes applied to product cost.
Target margin is an approved operating assumption, not an Etsy field. Marketplace help and policy define rule boundaries, refund and cancellation mechanics, fee credits, policy responsibilities, and protection conditions. Official sources do not replace the seller's measured costs.
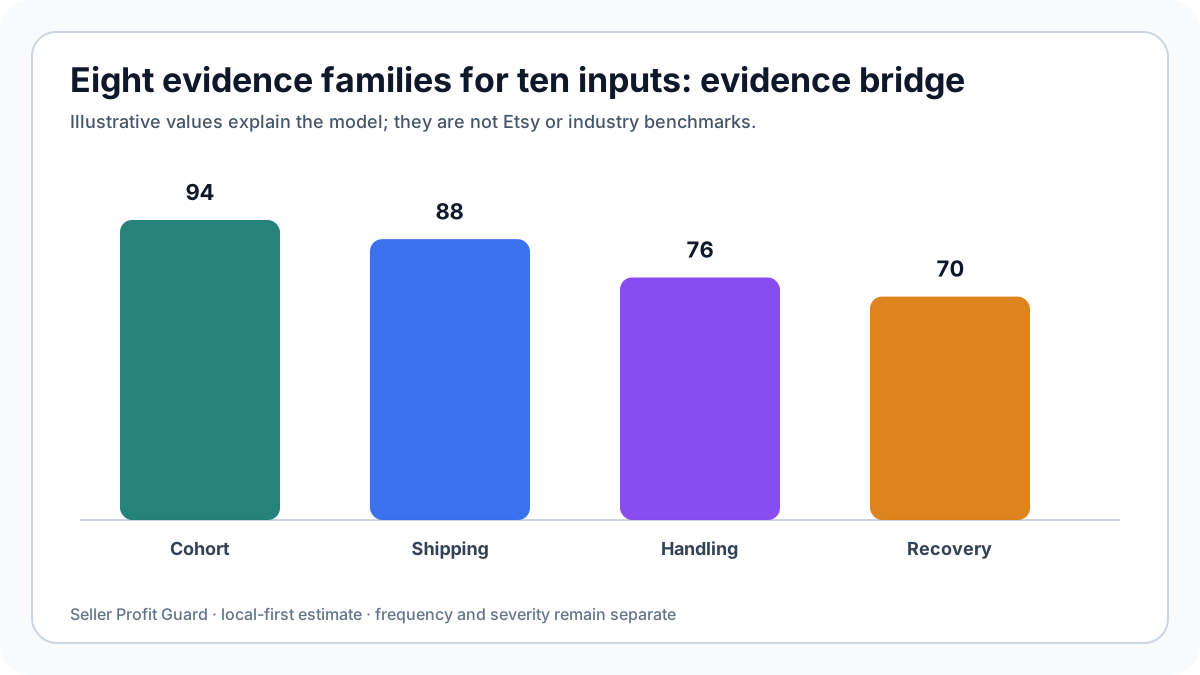
| Input family | Preferred source | Main risk |
|---|---|---|
| Revenue + fees | Order + Payment Account | Wrong fee base |
| Product cost | SKU cost record | Stale batch cost |
| Return rate | Mature product cohort | Immature cases |
| Shipping | Labels + adjustments | Advertised estimate |
| Handling | Measured task log | Unpriced labor |
| Recovery | Completed outcomes | Retail-price bias |
How is a mature return cohort constructed?
Choose an order period old enough for the declared return window, shipping delay, case resolution, and resale outcome. Define the market, product or defensible group, policy, fulfillment method, and exclusion rules. Count original orders once, classify each mature outcome once, and keep unresolved cases visible rather than forcing them into no-return or zero-recovery categories.
Use rolling cohorts cautiously. A recent price, promotion, product revision, package change, or traffic source can change buyer mix and product mix. Preserve versions before combining periods. Report the numerator, denominator, maturity cutoff, unresolved count, and excluded count with the rate.
For low-volume products, use a range or hierarchical comparison with a carefully chosen peer group, not a precise invented rate. Mark the assumption provisional and set a trigger for replacement with direct evidence. Do not manufacture demand or experience claims.

How should handling and recovery evidence be measured?
Time a bounded sample of the actual return workflow and use a documented labor rate if labor is included. Separate support, label administration, inspection, cleaning, repair, repackaging, disposal, and inventory tasks. Do not count ordinary fulfillment twice. Record automation savings only after observing them.
Recovery should be net of markdown, repair, repackaging, incremental marketplace fees, and disposal where relevant. Apply the recovery percentage to product cost because that is how the quick tool is defined. If the business needs recovered revenue or cash timing, use a separate schedule instead of altering the label.
A completed resale outcome is stronger than an intention to relist. Track time to recovery and items still held. A slow-moving recovered item can create inventory risk outside the quick estimate; disclose that exclusion or add a separate planning allowance.
What source-quality checks run before calculation?
Check completeness, uniqueness, units, currency, date range, cohort grain, maturity, duplicates, missing values, outliers, transformations, and reconciliation. Compare aggregate totals with an authoritative source. Inspect a privacy-safe sample and rerun the transformation. Store a fingerprint of the approved aggregate package.
Reject unexplained negative costs, rates outside 0–100%, identical values across unrelated products, return counts above original order counts, refunds without mapped outcomes, and recovery without completed evidence. Document accepted anomalies and their effect.
Assign an owner and freshness rule to every input. Event triggers include policy change, fee change, carrier change, product revision, package change, price or promotion change, material source shift, or a structural return spike. Source discipline is a recurring control, not a one-time content task.
Which records support this return-loss source map?
Use a product-level return-rate cohort, not a shop-wide percentage copied from memory. Reconcile completed sales, returns, exchanges, cancellations, cases, refunds, fee credits, return labels, replacement shipments, inspection work, restocking outcomes, markdowns, and write-offs for the same analysis period. The calculator needs aggregate operating values; it does not need buyer identity or a raw order file.
Separate platform evidence from seller assumptions. Etsy's current guidance explains return-policy requirements, agreements, fee credits, cancellations, Purchase Protection, and regional legal boundaries. It does not supply a universal return rate, resale recovery percentage, product cost, labor rate, or shipping loss for a particular shop. Those values must come from controlled seller records or be labeled as provisional.
Freeze the source period, currency, product cohort, policy version, calculation version, inclusion rules, exclusions, and fingerprints. Reperform one public dummy fixture by hand. A matching fingerprint proves that a file did not change; it does not prove the cohort represents future orders. Recalculate after a product, package, carrier, policy, marketplace, or fee-scope change.
- Keep refund amount, fee credit, and retained operating cost on separate lines.
- Segment resellable, markdown, damaged, lost, exchanged, and abandoned returns.
- Use actual label and handling evidence where available.
- Treat Purchase Protection as conditional, never guaranteed recovery.
- Verify legal, tax, and accounting treatment separately.
Privacy boundaries for return-loss source map
Return analysis can be completed with aggregate counts, rates, product costs, shipping costs, handling costs, and recovery outcomes. Buyer names, email addresses, phone numbers, postal addresses, order IDs, tracking numbers, messages, personalization, payment data, and case narratives are unnecessary. Replace individual examples with public dummy fixtures and aggregate outcome categories.
Return reasons and messages may reveal health details, family events, protected traits, disputes, or other sensitive context. Do not paste them into the calculator, article, analytics event, ticket, email draft, or community post. Keep controlled evidence under the existing retention policy, redact exports, and use non-reversible fingerprints when proving that an input package remained unchanged.
Seller costs, defect rates, carrier adjustments, recovery percentages, and policy exceptions are commercially sensitive even without buyer data. Public pages should use rounded fictional examples. Seller Profit Guard performs this quick calculation in the browser and does not require Etsy credentials, but the operator remains responsible for handling any source files privately.
How to use the calculator for this return-loss source map
Enter sale price, product cost, fulfillment cost, combined percentage fee assumption, expected return rate, lost outbound shipping, return shipping, restock or support cost, resale recovery percentage, and target margin. The tool calculates unrecovered product value, adds the three incident costs, multiplies loss per returned order by return rate, and subtracts that expected drag from contribution before returns.
The primary output is expected return loss per original order, not loss per retained order and not the buyer's refund amount. The tool also reports loss per returned order, contribution before returns, adjusted contribution, and the maximum return rate that still meets the entered target. It does not model tax, legal eligibility, case outcomes, cash timing, inventory aging, or every fee-credit rule.
Run representative, adverse, and clearly out-of-scope scenarios. Reconcile the displayed values by hand, compare headroom with input uncertainty, and record a bounded use, hold, redesign, or rollback decision. A score is only a convenience signal; it is not an Etsy rating, probability of a return, accounting opinion, or promise of profit.
- Define one product, period, market, policy, and outcome cohort.
- Enter evidence-backed costs and clearly labeled assumptions.
- Reperform loss per return and expected loss per order by hand.
- Stress-test recovery, shipping, return rate, and target margin.
- Record owner, decision, exception, next review, and rollback.
Sources and further reading
- Etsy Help: Refunds, Returns, and Exchanges for Sellers: Current Etsy seller guidance on listing return policies, return agreements, replacements, and Purchase Protection boundaries.
- Etsy Help: How to Cancel a Sale: Official workflow distinguishing a refund from cancellation and explaining related Etsy fee credits.
- Etsy Fees & Payments Policy: Current policy for transaction, payment-processing, listing, advertising, regulatory, and other seller charges.
- Etsy Seller Policy: Seller obligations, July 2026 return and case boundaries, buyer-data privacy, and region-specific legal responsibilities.
- Seller Profit Guard calculation methodology: Definitions for contribution, evidence hierarchy, editable assumptions, privacy, uncertainty, and non-advice limits.
Related Seller Profit Guard tools
- Open the Return Window Loss Calculator: Estimate loss per return, expected loss per order, adjusted contribution, and a target-safe return rate.
- Review refund fee impact: Separate buyer refund, fee credits, retained costs, cancellation, and operating loss.
- Calculate break-even ROAS and return loss: Connect expected incident loss to contribution, CPA, and ROAS decisions.
- Use the Etsy profit calculator: Reconcile actual order revenue, SKU cost, shipping, fees, and contribution evidence.
- Read the local-first methodology: Understand formula scope, source quality, privacy, and interpretation limits.
- Return Loss Formula: 10 Inputs Explained: Continue the return-loss evidence, calculation, and decision workflow.
- Return Loss Example: Resellable Item: Continue the return-loss evidence, calculation, and decision workflow.
- Return Loss for an Unsellable Item: Continue the return-loss evidence, calculation, and decision workflow.
- 12 Return Loss Calculator Mistakes: Continue the return-loss evidence, calculation, and decision workflow.
- Set a Safe Return Loss Threshold: Continue the return-loss evidence, calculation, and decision workflow.
Next step: Open the Return Window Loss Calculator.
This is operational planning help, not tax, accounting, legal, financial, or platform-policy advice. Review the Terms and disclaimer, and verify current platform rules and fee assumptions before changing prices.