How to interpret return window loss results
Last updated: 2026-07-29
Written and reviewed by Seller Profit Guard Editorial Team.
Interpret expected return loss as probability-weighted operating drag per original order under one declared scenario. Read it with loss per returned order, contribution before returns, adjusted contribution, target-safe return rate, source maturity, exclusions, and sensitivity. It is not the buyer refund, accounting net profit, legal responsibility, or a prediction for every order.

What does the primary expected-loss metric mean?
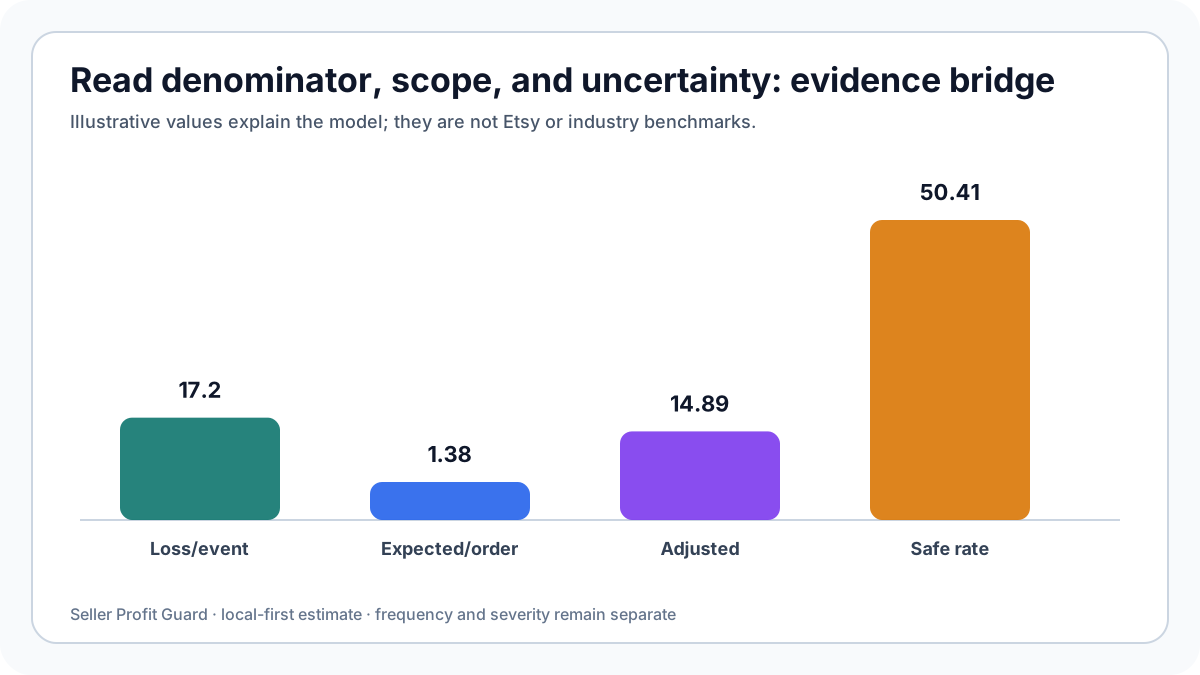
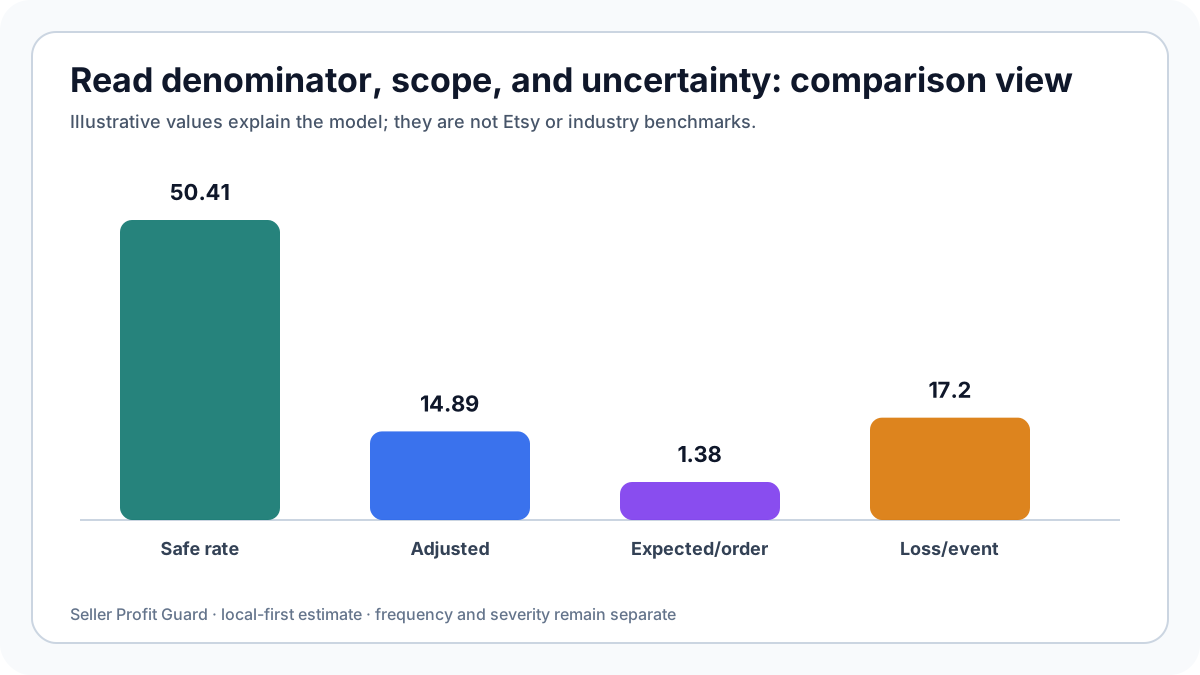
The primary metric multiplies loss severity for one returned order by the expected return rate for original orders. A $17.20 event loss at 8% produces $1.376 expected drag per original order. It is an average planning allowance across a cohort, not a claim that every order loses $1.38.
It is also not the refund amount. A full or partial refund changes revenue and cash, while fee credits, retained shipping, product recovery, handling, replacements, and protection determine operating loss. The quick tool begins with contribution before returns and subtracts modeled retained return cost.
Always publish the denominator: per original order. If the business needs loss per retained order, per shipped order, per return, or per customer, calculate and label that separately. Changing the denominator changes the number and its use.
| Output | Responsible meaning | Not evidence of |
|---|---|---|
| Expected loss | Per original order drag | Every-order loss |
| Loss per return | Incident severity | Refund amount |
| Adjusted contribution | Entered model | Net income |
| Safe rate | Target boundary | Forecast |
| Score | Convenience signal | Risk probability |
How should adjusted contribution and margin be read?
Contribution before returns subtracts entered product, fulfillment, and percentage fee costs from sale price. Adjusted contribution then subtracts expected return drag. The margin divides adjusted contribution by sale price. These outputs exclude any cost not entered or represented in the assumptions.
A positive adjusted contribution means the modeled order remains above zero on average; it does not meet a target automatically. Compare with target contribution and calculate dollar headroom. Then compare that headroom with plausible source error and adverse scenarios.
Do not describe contribution as accounting profit. Tax, fixed overhead, owner compensation, inventory carrying, financing, unmodeled ads, currency effects, and other costs may remain. Use precise labels in dashboards, exports, articles, and decision logs.

What does the maximum return rate at target prove?
The maximum rate solves the point where contribution before returns minus expected loss equals target contribution. It answers a sensitivity question under fixed incident severity and other inputs. It does not predict the next period's return rate or guarantee that conditions stay fixed.
If contribution before returns already misses target, the economic ceiling is zero even with no expected returns. If incident loss is zero, the tool reports no return loss rather than an infinite ceiling. Both outcomes require interpretation, not cosmetic suppression.
Compare the entered rate with the ceiling in percentage points and translate the gap to dollars. A two-point gap can be small when severity is high. Use representative and adverse severity before declaring headroom.
Which next action matches each output pattern?
If frequency drives expected loss, investigate product expectation, fit, variation, quality, audience, and policy-compatible prevention. If severity drives it, inspect shipping responsibility, package, handling, recovery, replacement, and condition classes. If contribution before returns is weak, fix base economics rather than blaming returns.
If evidence is immature or uncertainty exceeds headroom, measure or hold. If representative passes and adverse fails, narrow scope or add buffer. If both pass with strong evidence, use the bounded result and monitor. If live outcomes breach the declared trigger, roll back.
Record what the model cannot prove. Search ranking, traffic, conversion, buyer satisfaction, legal responsibility, and platform eligibility require separate evidence. A decision can still be useful when those unknowns are explicit.
Which records support this return-loss interpretation?
Use a product-level return-rate cohort, not a shop-wide percentage copied from memory. Reconcile completed sales, returns, exchanges, cancellations, cases, refunds, fee credits, return labels, replacement shipments, inspection work, restocking outcomes, markdowns, and write-offs for the same analysis period. The calculator needs aggregate operating values; it does not need buyer identity or a raw order file.
Separate platform evidence from seller assumptions. Etsy's current guidance explains return-policy requirements, agreements, fee credits, cancellations, Purchase Protection, and regional legal boundaries. It does not supply a universal return rate, resale recovery percentage, product cost, labor rate, or shipping loss for a particular shop. Those values must come from controlled seller records or be labeled as provisional.
Freeze the source period, currency, product cohort, policy version, calculation version, inclusion rules, exclusions, and fingerprints. Reperform one public dummy fixture by hand. A matching fingerprint proves that a file did not change; it does not prove the cohort represents future orders. Recalculate after a product, package, carrier, policy, marketplace, or fee-scope change.
- Keep refund amount, fee credit, and retained operating cost on separate lines.
- Segment resellable, markdown, damaged, lost, exchanged, and abandoned returns.
- Use actual label and handling evidence where available.
- Treat Purchase Protection as conditional, never guaranteed recovery.
- Verify legal, tax, and accounting treatment separately.
Privacy boundaries for return-loss interpretation
Return analysis can be completed with aggregate counts, rates, product costs, shipping costs, handling costs, and recovery outcomes. Buyer names, email addresses, phone numbers, postal addresses, order IDs, tracking numbers, messages, personalization, payment data, and case narratives are unnecessary. Replace individual examples with public dummy fixtures and aggregate outcome categories.
Return reasons and messages may reveal health details, family events, protected traits, disputes, or other sensitive context. Do not paste them into the calculator, article, analytics event, ticket, email draft, or community post. Keep controlled evidence under the existing retention policy, redact exports, and use non-reversible fingerprints when proving that an input package remained unchanged.
Seller costs, defect rates, carrier adjustments, recovery percentages, and policy exceptions are commercially sensitive even without buyer data. Public pages should use rounded fictional examples. Seller Profit Guard performs this quick calculation in the browser and does not require Etsy credentials, but the operator remains responsible for handling any source files privately.
How to use the calculator for this return-loss interpretation
Enter sale price, product cost, fulfillment cost, combined percentage fee assumption, expected return rate, lost outbound shipping, return shipping, restock or support cost, resale recovery percentage, and target margin. The tool calculates unrecovered product value, adds the three incident costs, multiplies loss per returned order by return rate, and subtracts that expected drag from contribution before returns.
The primary output is expected return loss per original order, not loss per retained order and not the buyer's refund amount. The tool also reports loss per returned order, contribution before returns, adjusted contribution, and the maximum return rate that still meets the entered target. It does not model tax, legal eligibility, case outcomes, cash timing, inventory aging, or every fee-credit rule.
Run representative, adverse, and clearly out-of-scope scenarios. Reconcile the displayed values by hand, compare headroom with input uncertainty, and record a bounded use, hold, redesign, or rollback decision. A score is only a convenience signal; it is not an Etsy rating, probability of a return, accounting opinion, or promise of profit.
- Define one product, period, market, policy, and outcome cohort.
- Enter evidence-backed costs and clearly labeled assumptions.
- Reperform loss per return and expected loss per order by hand.
- Stress-test recovery, shipping, return rate, and target margin.
- Record owner, decision, exception, next review, and rollback.
Sources and further reading
- Etsy Help: Refunds, Returns, and Exchanges for Sellers: Current Etsy seller guidance on listing return policies, return agreements, replacements, and Purchase Protection boundaries.
- Etsy Help: How to Cancel a Sale: Official workflow distinguishing a refund from cancellation and explaining related Etsy fee credits.
- Etsy Fees & Payments Policy: Current policy for transaction, payment-processing, listing, advertising, regulatory, and other seller charges.
- Etsy Seller Policy: Seller obligations, July 2026 return and case boundaries, buyer-data privacy, and region-specific legal responsibilities.
- Seller Profit Guard calculation methodology: Definitions for contribution, evidence hierarchy, editable assumptions, privacy, uncertainty, and non-advice limits.
Related Seller Profit Guard tools
- Open the Return Window Loss Calculator: Estimate loss per return, expected loss per order, adjusted contribution, and a target-safe return rate.
- Review refund fee impact: Separate buyer refund, fee credits, retained costs, cancellation, and operating loss.
- Calculate break-even ROAS and return loss: Connect expected incident loss to contribution, CPA, and ROAS decisions.
- Use the Etsy profit calculator: Reconcile actual order revenue, SKU cost, shipping, fees, and contribution evidence.
- Read the local-first methodology: Understand formula scope, source quality, privacy, and interpretation limits.
- Return Loss Formula: 10 Inputs Explained: Continue the return-loss evidence, calculation, and decision workflow.
- Return Loss Example: Resellable Item: Continue the return-loss evidence, calculation, and decision workflow.
- Return Loss for an Unsellable Item: Continue the return-loss evidence, calculation, and decision workflow.
- 12 Return Loss Calculator Mistakes: Continue the return-loss evidence, calculation, and decision workflow.
- Return Loss Data: 8 Reliable Sources: Continue the return-loss evidence, calculation, and decision workflow.
Next step: Open the Return Window Loss Calculator.
This is operational planning help, not tax, accounting, legal, financial, or platform-policy advice. Review the Terms and disclaimer, and verify current platform rules and fee assumptions before changing prices.