Seller Profit Guard · How it works · CSV privacy
Stockout cost calculator
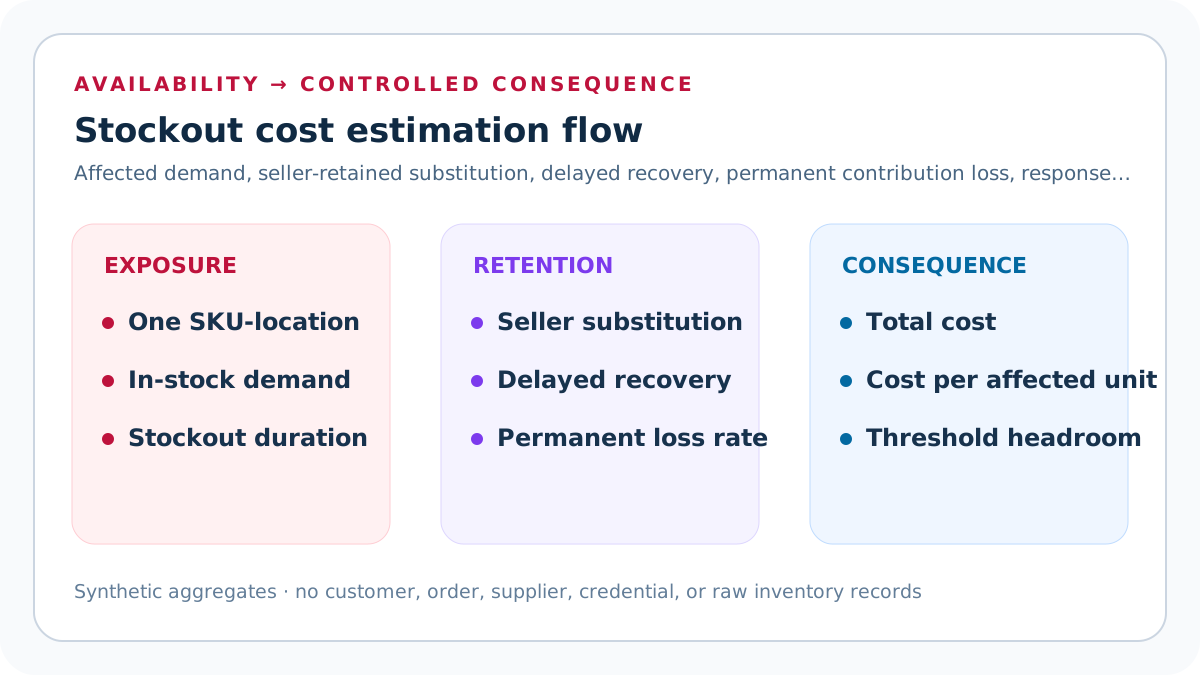
Estimate stockout cost by calculating demand affected during unavailable days, subtracting seller-retained substitutions and delayed recoveries, multiplying permanently lost units by contribution per unit, then adding delayed-recovery, service-remediation, and fixed mitigation costs. The result is an operating scenario—not unconstrained demand, accounting profit, customer lifetime value, a safety-stock setting, reorder point, or purchase authorization.
Maintained by Seller Profit Guard Editorial Team. Last reviewed: 2026-07-31.
Start with affected demand
Affected demand equals average daily demand multiplied by stockout days and a declared seasonality or event multiplier. Use comparable in-stock periods at one SKU-location grain.
This is a bounded estimate, not unconstrained-demand reconstruction.
Measure actual stockout days
Shopify defines days out of stock using each day's ending inventory at the item or location level. Reconcile zero or negative inventory with actual availability, channel status, overselling, and tracking history.
A system flag alone may not prove unavailability.
Separate substituted units
Substituted units equal affected demand multiplied by the entered substitution rate. A shopper may switch to another seller-owned SKU, another channel, a competitor, or no purchase.
Count only contribution retained inside the declared business scope.
Separate delayed recovery
Delayed recovered units equal initially unfilled units multiplied by the recovery rate. Backorders, waitlists, replenishment notices, transfers, and later repurchases can recover some demand.
Do not call every later order recovered without evidence.
Calculate permanently lost units
Permanently lost units equal affected demand minus substituted units minus delayed recovered units. The estimate should retain decimals because it is probability-weighted.
Operational plans still use whole units.
Use contribution, not retail revenue
Permanently lost contribution equals permanently lost units multiplied by per-unit contribution after order-variable costs. Oracle's lost-sales retail metric is useful context but retail value is not seller contribution.
Do not multiply by list price and call it profit.
Add delayed-recovery cost
Recovered units can require expedited replenishment, extra communication, split shipments, discounts, or handling. Multiply delayed recovered units by the documented incremental recovery cost.
Do not duplicate normal fulfillment.
Add service remediation
Multiply permanently lost units by a bounded remediation amount when credits, support work, apologies, or other direct recovery actions are expected and evidenced.
Do not invent customer lifetime value.
Add fixed mitigation cost
Include one-time transfer, expediting, emergency production, campaign pause, listing work, or operational response cost only when it belongs to the scenario.
Keep purchasing cost and inventory investment separate.
Read Scenario A
The short interruption fixture affects 36 units. After 25 percent substitution and 40 percent delayed recovery, 16.2 units are permanently lost.
Total estimated stockout cost is USD 390.20.
Read Scenario B
The seasonal fixture affects 294 units after a 1.4 demand multiplier. Ten percent substitute and 20 percent recover later, leaving 211.68 permanently lost units.
Total estimated stockout cost is USD 3,898.56.
Compare normalized scenarios
Both examples expose daily demand, duration, seasonality, substitution, delayed recovery, contribution, recovery cost, remediation, mitigation, evidence window, location, and currency.
Comparisons fail when any definition silently changes.
Keep out-of-stock and hidden listings separate
A SKU can appear unavailable because inventory is zero, the listing is paused, the channel is disabled, the variant is unpublished, the location cannot fulfill, or data is stale.
Classify the cause before assigning cost.
Keep substitution inside scope
Switching to another seller-owned product may retain contribution but change product mix, shipping, return risk, and customer experience. Competitor substitution is not retained.
Measure the actual boundary.
Keep backorders and later orders separate
A formal backorder with preserved customer intent is stronger evidence than a later order merely appearing after replenishment. Use cohort or order-state evidence where authorized.
Never expose buyer identities publicly.
Avoid double counting revenue and contribution
If per-unit contribution already subtracts product, fees, fulfillment, shipping, ads, and expected loss, do not add those same costs again.
Keep the cost dictionary visible.
Avoid double counting mitigation
Expediting can appear in recovery cost, fixed mitigation, inbound freight, purchasing variance, or fulfillment. Assign each amount once.
Reconcile the ledger.
Use one demand window
Choose complete comparable in-stock days, exclude known outages and tracking defects, and document promotions, seasonality, price, ranking, channel mix, and availability.
Short windows return Review.
Use one location grain
Shopify and Oracle expose location-aware availability and lost-sales views. Pool locations only when inventory, routing, assortment, price, and fulfillment rules support that treatment.
Transfers can mask local stockouts.
Use a declared threshold
The seller-entered maximum stockout cost is an escalation control, not a universal benchmark. The default USD 1,000 marks Scenario B for Review.
Threshold clearance does not approve purchasing.
Use three seller controls
Review total stockout cost, permanent-loss rate, and minimum comparable demand days together. The default fixtures use a USD 1,000 cost ceiling, 75 percent permanent-loss ceiling, and 60-day evidence floor.
Passing one control does not waive another.
Read permanent-loss rate
Divide permanently lost units by affected demand. Scenario A loses 45 percent of modeled demand and Scenario B loses 72 percent after seller-retained substitution and delayed recovery.
This probability-weighted rate is not observed causal lost sales.
Read retained-or-recovered rate
Divide substituted plus delayed-recovered units by affected demand. Scenario A retains or recovers 55 percent and Scenario B 28 percent inside the declared seller boundary.
Competitor substitution does not count as retained.
Read cost per affected unit
Divide estimated stockout cost by affected demand to normalize different durations and demand levels. The fixtures produce USD 10.84 and USD 13.26 per affected unit.
This is not retail price or cost per permanent loss.
Read threshold headroom
Subtract estimated cost from the seller cost ceiling and permanent-loss rate from its seller ceiling. Negative cost headroom or percentage-point headroom identifies the exact Review exception.
Headroom is an escalation aid, not purchase authority.
Use real source and policy dates
Record the latest availability, demand, contribution, and response-cost source review plus the effective date of the seller stockout policy. Policy cannot postdate reviewed evidence.
Impossible or reversed dates return Block.
Confirm nine evidence controls
Confirm SKU-location availability, comparable in-stock demand, substitution, delayed recovery, contribution, response costs, mature outcomes, aggregate privacy, and forecasting/purchasing/accounting boundaries.
Any missing confirmation returns Block.
Require materially different scenarios
Scenario B must change demand, duration, multiplier, substitution, recovery, contribution, response cost, or evidence days.
A copied scenario does not provide a stress comparison.
Mask invalid arithmetic
When a structural defect returns Block, affected units, loss, response costs, rates, per-unit metrics, and threshold headroom display Unavailable while the error list remains visible.
Do not use partial calculations from a blocked packet.
Classify Block, Review, and Ready
Block covers invalid demand, duration, rates, contribution, costs, evidence, scope, currency, or conflicts. Review covers short evidence, extended outages, or cost above threshold.
Ready means only that the entered packet clears those controls.
Run sensitivity
Change demand, duration, multiplier, substitution, delayed recovery, contribution, recovery cost, remediation, and mitigation one at a time. Record which inputs dominate the estimate.
Sensitivity exposes dependence, not causality.
Separate stockout cost from safety stock
Stockout cost can inform a broader service and inventory trade-off. It does not calculate the statistically appropriate buffer or select a service level.
Use the safety-stock tool separately.
Separate stockout cost from reorder point
A reorder point estimates when inventory position should trigger review. This tool estimates the consequence of an observed or scenario stockout.
It does not place a purchase order.
Separate stockout cost from lost customer value
The model excludes speculative lifetime value, brand damage, search ranking, word of mouth, and future channel effects unless separately evidenced.
Do not inflate the result with unverifiable multipliers.
Protect private records
Use aggregate demand, availability, substitution, recovery, and contribution inputs. Keep customer, order, address, supplier, purchase, credential, and raw export data in authorized systems.
The browser does not upload source rows.
Preserve an evidence ledger
Record source report, SKU-location, window, availability definition, transformation, exclusions, owner, timestamp, exception, and prior accepted value for every input.
A total without lineage is not auditable.
Monitor actual outcomes
After replenishment or mitigation, compare actual out-of-stock days, substituted sales, delayed orders, realized contribution, recovery work, remediation, and fixed costs with the accepted scenario.
Do not claim causal recovery without design.
Set stop and restoration rules
Stop a response when demand data, availability state, contribution, costs, supplier timing, policy, or customer communication conflicts emerge.
Retain the prior plan and inventory state.
Use related tools without collapsing intent
Safety stock, reorder point, carrying cost, dead-stock markdown, and contribution margin answer separate questions around the same inventory system.
Cross-link them but keep formulas distinct.
Use ten support artifacts
Formula, short example, seasonal case, mistakes, sources, threshold, comparison, routine, interpretation, and audit pages each solve a different operational query.
They are not keyword substitutions.
Release only after quality gates
Validate calculation, direct answers, sources, originality, similarity, metadata, schema, images, links, mobile behavior, strict routes, backups, build, deployment, and live behavior.
Search signals are measured later.
Sources and further reading
- Shopify Help: Analytics data points reference: Official definitions for days out of stock, days in stock, inventory units sold per day, and location-level availability.
- Shopify Help: Inventory reports: Official inventory definitions for Available, Committed, Incoming, daily unit sales, sell-through, days remaining, overselling, adjustments, and report latency.
- Microsoft Business Central: Inventory Availability: Current official on-hand, sales-order, purchase-order, transfer, expected-supply, expected-demand, and projected-shortage context.
- Oracle Retail Inventory Planning User Guide: Current official out-of-stock alert, forecasted-sales, order-point, order-up-to-level, safety-stock, and service-level planning boundaries.
- Seller Profit Guard methodology: Evidence, formula, privacy, correction, release, monitoring, and rollback rules.
- Seller Profit Guard data privacy: Local-first boundaries for SKU, inventory, supplier, customer, order, and raw export data.
Related Seller Profit Guard tools
- Etsy CSV profit calculator: Run a local order profit check with editable fee and SKU cost assumptions.
- Payment reconciliation tool: Compare order rows with statement activity and flag unmatched rows.
- SKU cost library: Save or import material, labor, packaging, shipping, and target margin assumptions.
- Variant risk checker: Find missing SKUs and variation cost risks before a listing scales.
- Etsy title checker: Review listing-title clarity, repetition, keyword chains, and mobile scanning.
- Etsy tag checker: Review all 13 tag slots for duplicates, repeated meaning, and truthful coverage.
- Free shipping threshold calculator: Estimate when a shipping subsidy can still meet a target margin.
- Return window loss estimator: Model expected reverse shipping, restock work, recovery, and replacement loss.
- Etsy Ads break-even calculator: Estimate target-safe Etsy Ads spend, ACOS, and ROAS after fees, fulfillment, and expected return loss.
- CSV data privacy: Understand what the local-first workflow needs and what it does not need.
- Stockout Cost Formula and Inputs: Define affected demand, stockout days, substitution, delayed recovery, contribution, response costs, scope, and evidence.
- Stockout Cost Calculator Worked Example: Reperform a three-day interruption through affected demand, substitution, delayed recovery, permanent loss, and total cost.
- Seasonal Stockout Cost Scenario: Reperform a seasonal stockout with elevated demand, lower substitution and recovery, contribution loss, remediation, and mitigation.
- Stockout Cost Modeling Mistakes: Find availability, demand, substitution, recovery, contribution, duplication, duration, privacy, and decision errors with corrections.
- Stockout Cost Calculator Data Sources: Map availability days, in-stock demand, substitution, delayed recovery, contribution, remediation, and mitigation to controlled evidence.
- Stockout Cost Decision Threshold: Set a seller-owned cost threshold, evidence floor, sensitivity range, approval boundary, monitoring rule, and restoration trigger.
- Short vs Seasonal Stockout Cost: Compare short and seasonal stockouts across demand, duration, substitution, recovery, contribution, response cost, uncertainty, and controls.
- Weekly Stockout Cost Review Routine: Run a weekly availability reconciliation, scenario update, review, mitigation, monitoring, exception, and rollback cycle.
- Interpret Stockout Cost Results: Interpret affected demand, substitution, recovery, permanent loss, contribution, cost per day, status, and uncertainty without false precision.
- Stockout Cost Calculator Audit Template: Audit availability, demand, substitution, recovery, contribution, costs, formula, approvals, monitoring, privacy, and rollback.
Use the interactive tool
Enable JavaScript to open the calculator and process browser-local inputs. The explanatory content and source links remain available without JavaScript.
Related guide: Define affected demand, substitution, delayed recovery, permanent loss, contribution, remediation, mitigation, and evidence controls.
This tool provides operating estimates, not tax, accounting, legal, financial, or marketplace-policy advice. Verify current official sources and your own records before changing prices or operations.