Stockout cost worked example for a short interruption
Last updated: 2026-07-31
Written and reviewed by Seller Profit Guard Editorial Team.
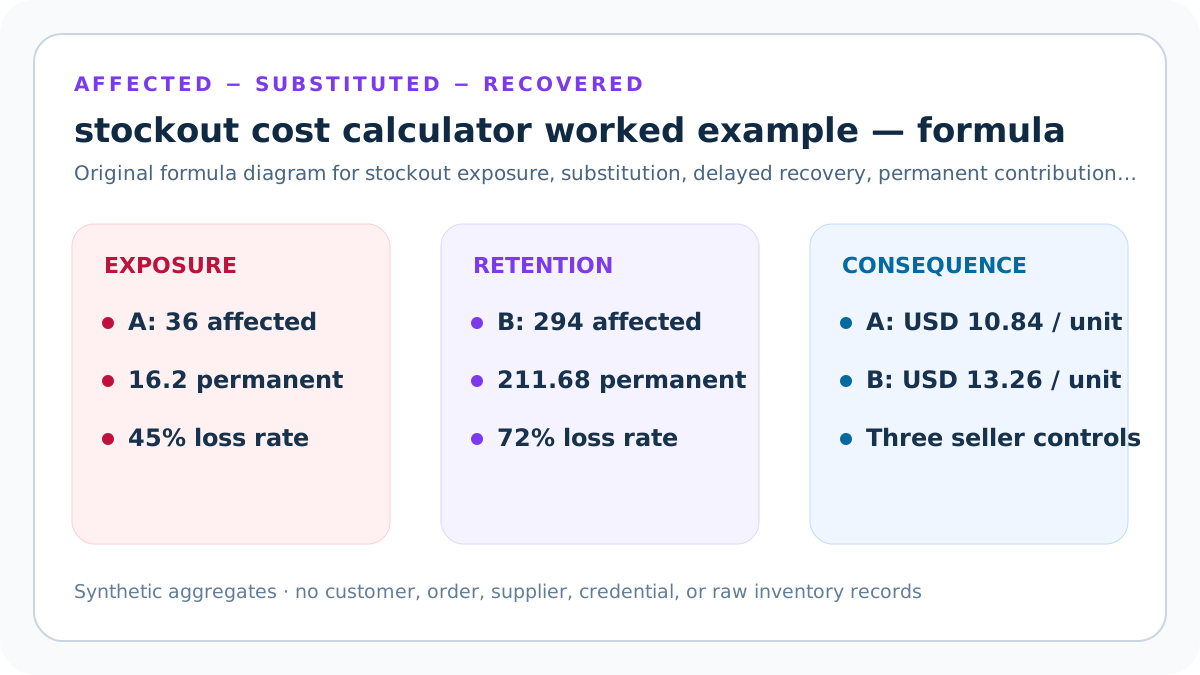
A three-day stockout at 12 daily units affects 36 units in this synthetic example. After 25 percent substitution and 40 percent recovery of initially unfilled demand, 16.2 units remain permanently lost. Lost contribution, recovery work, remediation, and fixed mitigation produce USD 390.20 estimated cost, or USD 130.07 per day.
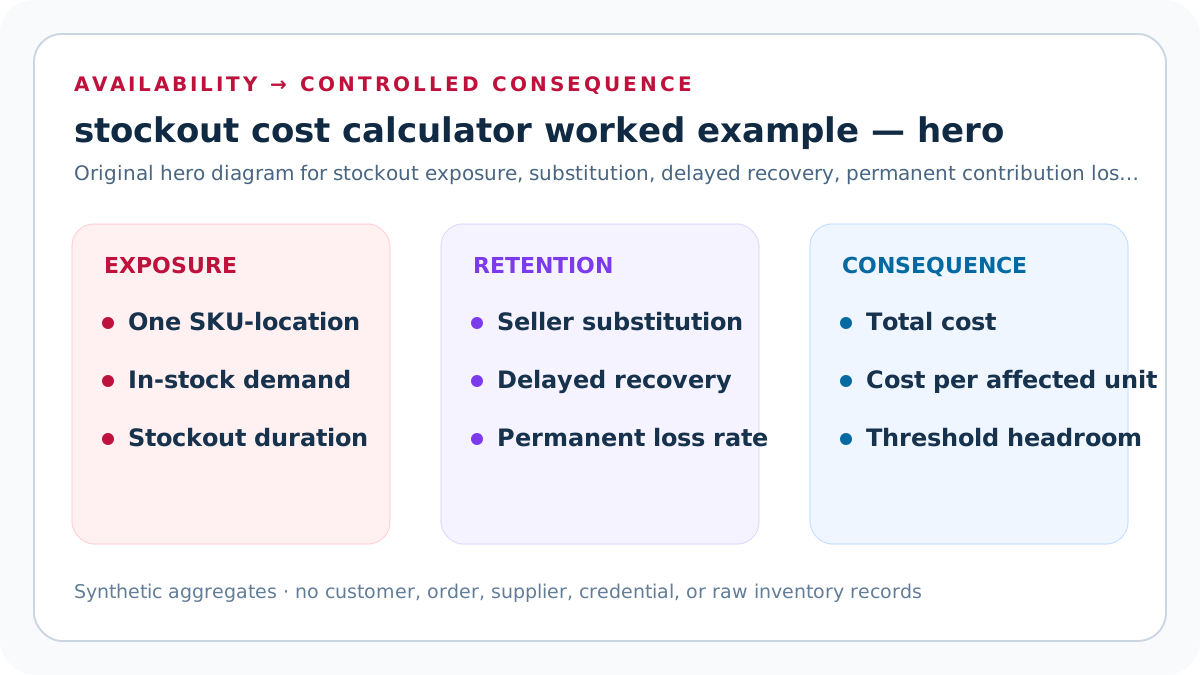
Confirm the three-day outage
Verify one SKU-location was truly unavailable for three full days. The short-interruption workpaper records source, location, availability rule, period, unit, currency, transformation, timestamp, owner, reviewer, exception, and prior accepted value needed for a traceable Scenario A calculation.
Exclude tracking errors. At checkpoint 1, reperform both fixtures, identify the changed stockout-cost term, and state which inventory, purchasing, accounting, customer, policy, or privacy conclusion remains outside the calculator.
Calculate 36 affected units
Multiply 12 daily units by three days and 1.0. The short-interruption workpaper records source, location, availability rule, period, unit, currency, transformation, timestamp, owner, reviewer, exception, and prior accepted value needed for a traceable Scenario A calculation.
Keep demand evidence visible. At checkpoint 2, reperform both fixtures, identify the changed stockout-cost term, and state which inventory, purchasing, accounting, customer, policy, or privacy conclusion remains outside the calculator.
Calculate nine substitutions
Apply 25 percent to affected demand. The short-interruption workpaper records source, location, availability rule, period, unit, currency, transformation, timestamp, owner, reviewer, exception, and prior accepted value needed for a traceable Scenario A calculation.
Confirm seller-retained contribution. At checkpoint 3, reperform both fixtures, identify the changed stockout-cost term, and state which inventory, purchasing, accounting, customer, policy, or privacy conclusion remains outside the calculator.
Calculate 27 unfilled units
Subtract substitutions from affected demand. The short-interruption workpaper records source, location, availability rule, period, unit, currency, transformation, timestamp, owner, reviewer, exception, and prior accepted value needed for a traceable Scenario A calculation.
Do not label all permanent. At checkpoint 4, reperform both fixtures, identify the changed stockout-cost term, and state which inventory, purchasing, accounting, customer, policy, or privacy conclusion remains outside the calculator.
Calculate 10.8 delayed recoveries
Apply 40 percent to initially unfilled units. The short-interruption workpaper records source, location, availability rule, period, unit, currency, transformation, timestamp, owner, reviewer, exception, and prior accepted value needed for a traceable Scenario A calculation.
Expected values can be fractional. At checkpoint 5, reperform both fixtures, identify the changed stockout-cost term, and state which inventory, purchasing, accounting, customer, policy, or privacy conclusion remains outside the calculator.
Calculate 16.2 permanent losses
Subtract delayed recovery from initially unfilled units. The short-interruption workpaper records source, location, availability rule, period, unit, currency, transformation, timestamp, owner, reviewer, exception, and prior accepted value needed for a traceable Scenario A calculation.
This remains an estimate. At checkpoint 6, reperform both fixtures, identify the changed stockout-cost term, and state which inventory, purchasing, accounting, customer, policy, or privacy conclusion remains outside the calculator.
Calculate USD 291.60 contribution loss
Multiply permanent units by USD 18. The short-interruption workpaper records source, location, availability rule, period, unit, currency, transformation, timestamp, owner, reviewer, exception, and prior accepted value needed for a traceable Scenario A calculation.
Use contribution, not price. At checkpoint 7, reperform both fixtures, identify the changed stockout-cost term, and state which inventory, purchasing, accounting, customer, policy, or privacy conclusion remains outside the calculator.
Add USD 32.40 recovery work
Multiply delayed recoveries by USD 3. The short-interruption workpaper records source, location, availability rule, period, unit, currency, transformation, timestamp, owner, reviewer, exception, and prior accepted value needed for a traceable Scenario A calculation.
Exclude normal fulfillment. At checkpoint 8, reperform both fixtures, identify the changed stockout-cost term, and state which inventory, purchasing, accounting, customer, policy, or privacy conclusion remains outside the calculator.
Add USD 16.20 remediation and USD 50 mitigation
Keep unit-variable and fixed responses separate. The short-interruption workpaper records source, location, availability rule, period, unit, currency, transformation, timestamp, owner, reviewer, exception, and prior accepted value needed for a traceable Scenario A calculation.
Trace source evidence. At checkpoint 9, reperform both fixtures, identify the changed stockout-cost term, and state which inventory, purchasing, accounting, customer, policy, or privacy conclusion remains outside the calculator.
Calculate USD 390.20 total
Sum four components and divide by three for USD 130.07 per day. The short-interruption workpaper records source, location, availability rule, period, unit, currency, transformation, timestamp, owner, reviewer, exception, and prior accepted value needed for a traceable Scenario A calculation.
Review threshold separately. At checkpoint 10, reperform both fixtures, identify the changed stockout-cost term, and state which inventory, purchasing, accounting, customer, policy, or privacy conclusion remains outside the calculator.
Stockout Cost Calculator Worked Example: availability integrity control
Keep one SKU-location, sellability state, daily boundary, channel, and reason code. Control 1 defines a pass condition, evidence owner, independent reviewer, correction deadline, sensitivity range, monitoring signal, stop condition, and restoration trigger for a traceable Scenario A calculation.
False stockouts block. Apply it while keeping affected demand, substitution, delayed recovery, permanent loss, contribution, response costs, threshold, and approval authority separate.
Stockout Cost Calculator Worked Example: demand and recovery lineage control
Record comparable in-stock demand, substitution scope, delayed-recovery rule, and evidence window. Control 2 defines a pass condition, evidence owner, independent reviewer, correction deadline, sensitivity range, monitoring signal, stop condition, and restoration trigger for a traceable Scenario A calculation.
Unsupported rates review. Apply it while keeping affected demand, substitution, delayed recovery, permanent loss, contribution, response costs, threshold, and approval authority separate.
Stockout Cost Calculator Worked Example: contribution and cost separation control
Use one contribution dictionary and map recovery, remediation, and mitigation once. Control 3 defines a pass condition, evidence owner, independent reviewer, correction deadline, sensitivity range, monitoring signal, stop condition, and restoration trigger for a traceable Scenario A calculation.
Duplicates block. Apply it while keeping affected demand, substitution, delayed recovery, permanent loss, contribution, response costs, threshold, and approval authority separate.
Stockout Cost Calculator Worked Example: three seller controls control
Compare total cost, permanent-loss rate, and comparable-demand days with three independently entered thresholds. Control 4 defines a pass condition, evidence owner, independent reviewer, correction deadline, sensitivity range, monitoring signal, stop condition, and restoration trigger for a traceable Scenario A calculation.
One passing control cannot override another. Apply it while keeping affected demand, substitution, delayed recovery, permanent loss, contribution, response costs, threshold, and approval authority separate.
Stockout Cost Calculator Worked Example: dated evidence governance control
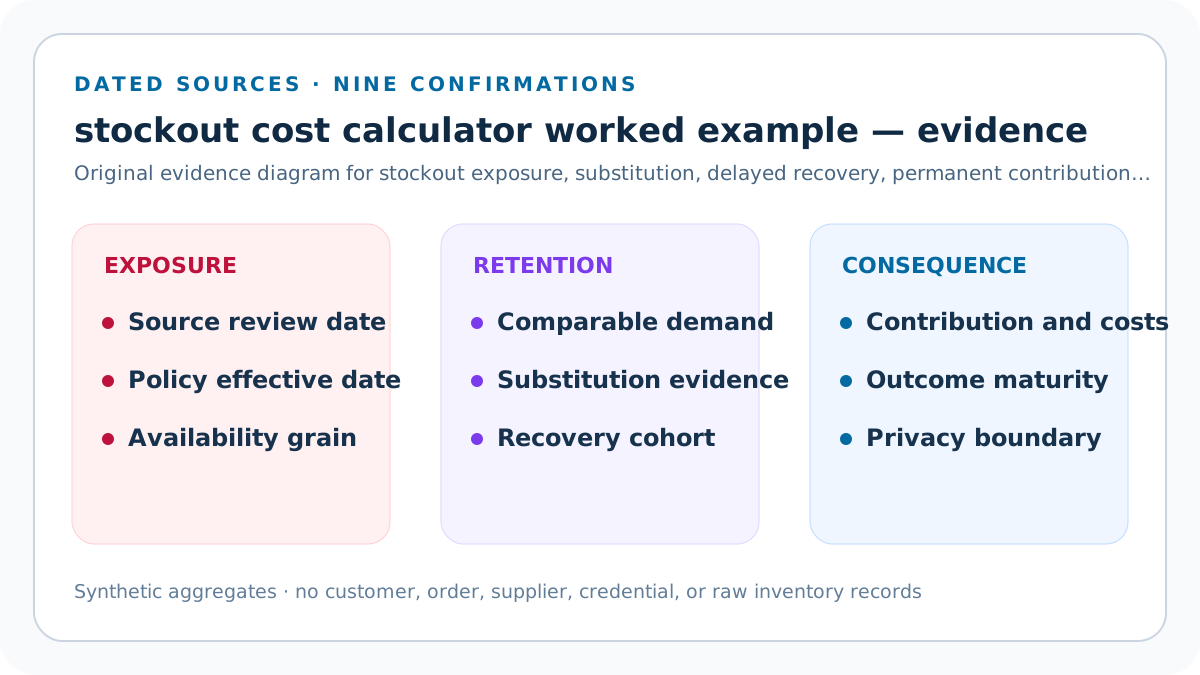
Record real source-review and policy-effective dates, with the policy no later than the reviewed evidence. Control 5 defines a pass condition, evidence owner, independent reviewer, correction deadline, sensitivity range, monitoring signal, stop condition, and restoration trigger for a traceable Scenario A calculation.
Impossible or reversed dates block. Apply it while keeping affected demand, substitution, delayed recovery, permanent loss, contribution, response costs, threshold, and approval authority separate.
Stockout Cost Calculator Worked Example: nine confirmations control
Confirm availability grain, demand, substitution, delayed recovery, contribution, response costs, outcome maturity, privacy, and planning boundaries. Control 6 defines a pass condition, evidence owner, independent reviewer, correction deadline, sensitivity range, monitoring signal, stop condition, and restoration trigger for a traceable Scenario A calculation.
Any missing confirmation blocks. Apply it while keeping affected demand, substitution, delayed recovery, permanent loss, contribution, response costs, threshold, and approval authority separate.
Stockout Cost Calculator Worked Example: distinct scenarios control
Change at least one demand, duration, multiplier, recovery, contribution, response-cost, or evidence assumption between cases. Control 7 defines a pass condition, evidence owner, independent reviewer, correction deadline, sensitivity range, monitoring signal, stop condition, and restoration trigger for a traceable Scenario A calculation.
A copied scenario is not a stress test. Apply it while keeping affected demand, substitution, delayed recovery, permanent loss, contribution, response costs, threshold, and approval authority separate.
Stockout Cost Calculator Worked Example: output masking control
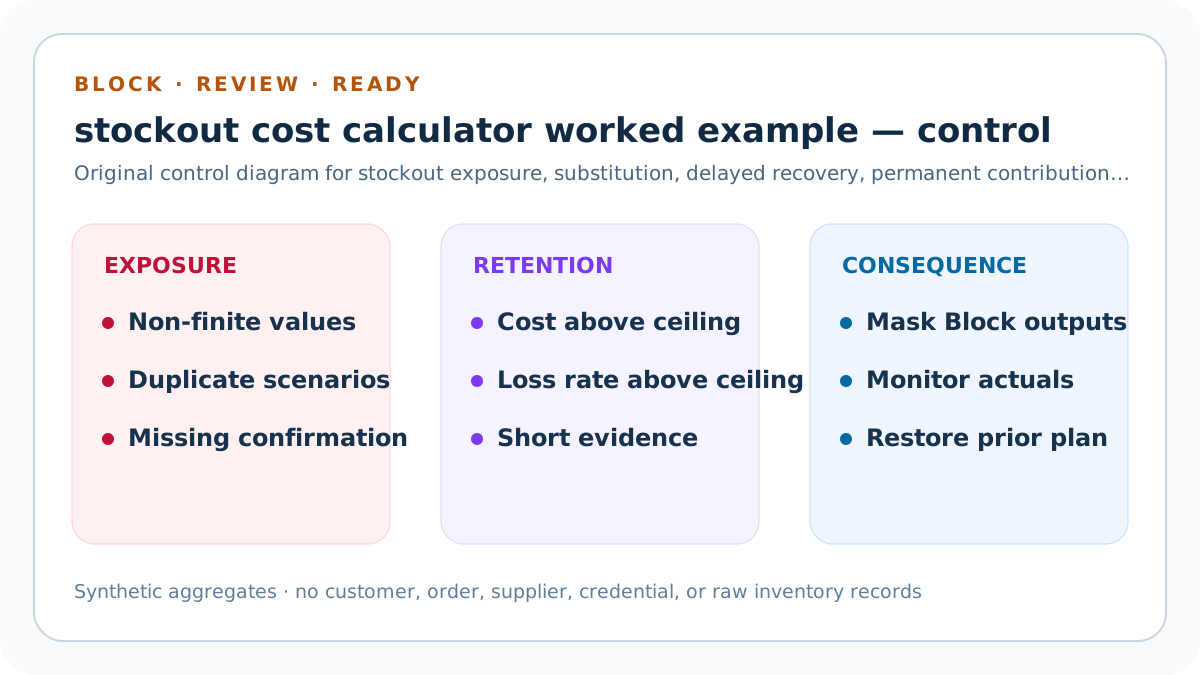
Mask derived units, money, rates, per-unit values, and threshold gaps whenever structural validation returns Block. Control 8 defines a pass condition, evidence owner, independent reviewer, correction deadline, sensitivity range, monitoring signal, stop condition, and restoration trigger for a traceable Scenario A calculation.
Never use partial invalid arithmetic. Apply it while keeping affected demand, substitution, delayed recovery, permanent loss, contribution, response costs, threshold, and approval authority separate.
Stockout Cost Calculator Worked Example: decision boundary control
Separate consequence estimation from forecasting, safety stock, reorder point, quantity, purchasing, accounting, and customer-value claims. Control 9 defines a pass condition, evidence owner, independent reviewer, correction deadline, sensitivity range, monitoring signal, stop condition, and restoration trigger for a traceable Scenario A calculation.
Arithmetic cannot authorize. Apply it while keeping affected demand, substitution, delayed recovery, permanent loss, contribution, response costs, threshold, and approval authority separate.
Stockout Cost Calculator Worked Example: privacy and restoration control
Use aggregates, protect source rows, monitor actuals, retain prior settings, and define rollback. Control 10 defines a pass condition, evidence owner, independent reviewer, correction deadline, sensitivity range, monitoring signal, stop condition, and restoration trigger for a traceable Scenario A calculation.
Public buyer data is prohibited. Apply it while keeping affected demand, substitution, delayed recovery, permanent loss, contribution, response costs, threshold, and approval authority separate.
Confirm the three-day outage: stockout lab 1
Recalculate the relevant outputs from both fixtures. Verify one SKU-location was truly unavailable for three full days. Change one input only, preserve the remaining scope and cost assumptions, and record affected units, permanent units, lost contribution, response costs, total cost, cost per day, and status.
Exclude tracking errors. Test low, base, and high demand, duration, substitution, recovery, contribution, and cost values. Explain the dominant driver and protected evidence still required before any operational action.
Calculate 36 affected units: stockout lab 2
Recalculate the relevant outputs from both fixtures. Multiply 12 daily units by three days and 1.0. Change one input only, preserve the remaining scope and cost assumptions, and record affected units, permanent units, lost contribution, response costs, total cost, cost per day, and status.
Keep demand evidence visible. Test low, base, and high demand, duration, substitution, recovery, contribution, and cost values. Explain the dominant driver and protected evidence still required before any operational action.
Calculate nine substitutions: stockout lab 3
Recalculate the relevant outputs from both fixtures. Apply 25 percent to affected demand. Change one input only, preserve the remaining scope and cost assumptions, and record affected units, permanent units, lost contribution, response costs, total cost, cost per day, and status.
Confirm seller-retained contribution. Test low, base, and high demand, duration, substitution, recovery, contribution, and cost values. Explain the dominant driver and protected evidence still required before any operational action.
Calculate 27 unfilled units: stockout lab 4
Recalculate the relevant outputs from both fixtures. Subtract substitutions from affected demand. Change one input only, preserve the remaining scope and cost assumptions, and record affected units, permanent units, lost contribution, response costs, total cost, cost per day, and status.
Do not label all permanent. Test low, base, and high demand, duration, substitution, recovery, contribution, and cost values. Explain the dominant driver and protected evidence still required before any operational action.
Calculate 10.8 delayed recoveries: stockout lab 5
Recalculate the relevant outputs from both fixtures. Apply 40 percent to initially unfilled units. Change one input only, preserve the remaining scope and cost assumptions, and record affected units, permanent units, lost contribution, response costs, total cost, cost per day, and status.
Expected values can be fractional. Test low, base, and high demand, duration, substitution, recovery, contribution, and cost values. Explain the dominant driver and protected evidence still required before any operational action.
Calculate 16.2 permanent losses: stockout lab 6
Recalculate the relevant outputs from both fixtures. Subtract delayed recovery from initially unfilled units. Change one input only, preserve the remaining scope and cost assumptions, and record affected units, permanent units, lost contribution, response costs, total cost, cost per day, and status.
This remains an estimate. Test low, base, and high demand, duration, substitution, recovery, contribution, and cost values. Explain the dominant driver and protected evidence still required before any operational action.
Calculate USD 291.60 contribution loss: stockout lab 7
Recalculate the relevant outputs from both fixtures. Multiply permanent units by USD 18. Change one input only, preserve the remaining scope and cost assumptions, and record affected units, permanent units, lost contribution, response costs, total cost, cost per day, and status.
Use contribution, not price. Test low, base, and high demand, duration, substitution, recovery, contribution, and cost values. Explain the dominant driver and protected evidence still required before any operational action.
Add USD 32.40 recovery work: stockout lab 8
Recalculate the relevant outputs from both fixtures. Multiply delayed recoveries by USD 3. Change one input only, preserve the remaining scope and cost assumptions, and record affected units, permanent units, lost contribution, response costs, total cost, cost per day, and status.
Exclude normal fulfillment. Test low, base, and high demand, duration, substitution, recovery, contribution, and cost values. Explain the dominant driver and protected evidence still required before any operational action.
Add USD 16.20 remediation and USD 50 mitigation: stockout lab 9
Recalculate the relevant outputs from both fixtures. Keep unit-variable and fixed responses separate. Change one input only, preserve the remaining scope and cost assumptions, and record affected units, permanent units, lost contribution, response costs, total cost, cost per day, and status.
Trace source evidence. Test low, base, and high demand, duration, substitution, recovery, contribution, and cost values. Explain the dominant driver and protected evidence still required before any operational action.
Calculate USD 390.20 total: stockout lab 10
Recalculate the relevant outputs from both fixtures. Sum four components and divide by three for USD 130.07 per day. Change one input only, preserve the remaining scope and cost assumptions, and record affected units, permanent units, lost contribution, response costs, total cost, cost per day, and status.
Review threshold separately. Test low, base, and high demand, duration, substitution, recovery, contribution, and cost values. Explain the dominant driver and protected evidence still required before any operational action.
Stockout Cost Calculator Worked Example: intent-specific implementation walkthrough
short-interruption workpaper checkpoint 1 addresses confirm the three-day outage for a traceable Scenario A calculation. Verify one SKU-location was truly unavailable for three full days. Record the source decision, formula effect, failed alternative, reviewer question, correction owner, monitoring signal, and restoration value. Exclude tracking errors.
short-interruption workpaper checkpoint 2 addresses calculate 36 affected units for a traceable Scenario A calculation. Multiply 12 daily units by three days and 1.0. Record the source decision, formula effect, failed alternative, reviewer question, correction owner, monitoring signal, and restoration value. Keep demand evidence visible.
short-interruption workpaper checkpoint 3 addresses calculate nine substitutions for a traceable Scenario A calculation. Apply 25 percent to affected demand. Record the source decision, formula effect, failed alternative, reviewer question, correction owner, monitoring signal, and restoration value. Confirm seller-retained contribution.
short-interruption workpaper checkpoint 4 addresses calculate 27 unfilled units for a traceable Scenario A calculation. Subtract substitutions from affected demand. Record the source decision, formula effect, failed alternative, reviewer question, correction owner, monitoring signal, and restoration value. Do not label all permanent.
short-interruption workpaper checkpoint 5 addresses calculate 10.8 delayed recoveries for a traceable Scenario A calculation. Apply 40 percent to initially unfilled units. Record the source decision, formula effect, failed alternative, reviewer question, correction owner, monitoring signal, and restoration value. Expected values can be fractional.
short-interruption workpaper checkpoint 6 addresses calculate 16.2 permanent losses for a traceable Scenario A calculation. Subtract delayed recovery from initially unfilled units. Record the source decision, formula effect, failed alternative, reviewer question, correction owner, monitoring signal, and restoration value. This remains an estimate.
short-interruption workpaper checkpoint 7 addresses calculate usd 291.60 contribution loss for a traceable Scenario A calculation. Multiply permanent units by USD 18. Record the source decision, formula effect, failed alternative, reviewer question, correction owner, monitoring signal, and restoration value. Use contribution, not price.
short-interruption workpaper checkpoint 8 addresses add usd 32.40 recovery work for a traceable Scenario A calculation. Multiply delayed recoveries by USD 3. Record the source decision, formula effect, failed alternative, reviewer question, correction owner, monitoring signal, and restoration value. Exclude normal fulfillment.
short-interruption workpaper checkpoint 9 addresses add usd 16.20 remediation and usd 50 mitigation for a traceable Scenario A calculation. Keep unit-variable and fixed responses separate. Record the source decision, formula effect, failed alternative, reviewer question, correction owner, monitoring signal, and restoration value. Trace source evidence.
short-interruption workpaper checkpoint 10 addresses calculate usd 390.20 total for a traceable Scenario A calculation. Sum four components and divide by three for USD 130.07 per day. Record the source decision, formula effect, failed alternative, reviewer question, correction owner, monitoring signal, and restoration value. Review threshold separately.
Evidence boundary for a traceable Scenario A calculation
The short-interruption fixture uses 12 average daily units, three stockout days, a 1.0 multiplier, 25 percent substitution, 40 percent delayed recovery, USD 18 contribution, USD 3 recovery cost, USD 1 remediation per permanent loss, and USD 50 fixed mitigation. It estimates 16.2 permanently lost units and USD 390.20 total stockout cost. The seasonal fixture uses 30 average daily units, seven stockout days, a 1.4 multiplier, 10 percent substitution, 20 percent delayed recovery, USD 14 contribution, USD 4 recovery cost, USD 2 remediation per permanent loss, and USD 300 fixed mitigation. It estimates 211.68 permanently lost units and USD 3,898.56 total stockout cost.
The enhanced packet also shows permanent-loss rates of 45 and 72 percent, retained-or-recovered rates of 55 and 28 percent, and stockout cost per affected unit of USD 10.84 and USD 13.26. It demonstrates entered arithmetic and sensitivity but cannot prove unconstrained demand, causal lost sales, customer churn, optimal inventory, service level, supplier performance, accounting profit, tax treatment, or the correct business action.
Release, monitor, and restore the short-interruption workpaper
Block invalid or non-finite demand, duration, multipliers, rates, contribution, costs, dates, confirmations, duplicated scenarios, evidence, scope, currency, privacy, or conflicts, and mask every derived output. Review short evidence, extended outages, cost above the seller ceiling, or permanent-loss rate above its seller ceiling. Ready clears only all three thresholds, nine confirmations, and the remaining entered controls.
Before indexing or operational use, preserve evidence and rollback artifacts; run typecheck, unit, integration, build, content, similarity, SEO, image, link, mobile, strict-route, deployment, and live checks; then compare later evidence without claiming same-period causality.
Stockout Cost Calculator Worked Example: concrete working record
Record the full short-interruption workpaper: SKU-location, availability definition, outage dates, comparable demand, exclusions, multiplier, substitution, recovery, contribution dictionary, response costs, formula version, sensitivity, threshold, owners, approvals, monitoring, exceptions, stop rules, and restoration evidence for a traceable Scenario A calculation.
Sources and further reading
- Seller Profit Guard methodology: Evidence, formula, privacy, correction, release, monitoring, and rollback rules.
- Seller Profit Guard data privacy: Local-first boundaries for inventory, supplier, customer, order, and raw export data.
- Shopify Help: Analytics data points reference: Official definitions for days out of stock, days in stock, daily units, and location-aware availability.
- Shopify Help: Inventory reports: Official Available, Committed, Incoming, daily sales, sell-through, days remaining, overselling, adjustment, and processing-limit context.
- Microsoft Business Central: Inventory Availability: Current official on-hand, sales-order, purchase-order, transfer, expected-supply, expected-demand, and projected-shortage context.
- Oracle Retail Inventory Planning User Guide: Current official out-of-stock alert, forecasted-sales, order-point, order-up-to-level, safety-stock, and service-level planning boundaries.
Related Seller Profit Guard tools
- Stockout Cost Calculator: Estimate permanent contribution loss and bounded recovery, remediation, and mitigation costs.
- Safety Stock Calculator: Estimate a variability buffer separately from an outage consequence.
- Reorder Point Calculator: Calculate an inventory-position trigger separately from stockout loss.
- Inventory Carrying Cost Calculator: Compare availability risk with the annual burden of holding stock.
- Methodology: Review evidence, formula, privacy, correction, release, and rollback.
- Data Privacy: Protect inventory, supplier, customer, order, and raw export data.
- Stockout Cost Formula and Inputs: Define affected demand, stockout days, substitution, delayed recovery, contribution, response costs, scope, and evidence.
- Seasonal Stockout Cost Scenario: Reperform a seasonal stockout with elevated demand, lower substitution and recovery, contribution loss, remediation, and mitigation.
- Stockout Cost Modeling Mistakes: Find availability, demand, substitution, recovery, contribution, duplication, duration, privacy, and decision errors with corrections.
- Stockout Cost Calculator Data Sources: Map availability days, in-stock demand, substitution, delayed recovery, contribution, remediation, and mitigation to controlled evidence.
- Stockout Cost Decision Threshold: Set a seller-owned cost threshold, evidence floor, sensitivity range, approval boundary, monitoring rule, and restoration trigger.
- Short vs Seasonal Stockout Cost: Compare short and seasonal stockouts across demand, duration, substitution, recovery, contribution, response cost, uncertainty, and controls.
- Weekly Stockout Cost Review Routine: Run a weekly availability reconciliation, scenario update, review, mitigation, monitoring, exception, and rollback cycle.
- Interpret Stockout Cost Results: Interpret affected demand, substitution, recovery, permanent loss, contribution, cost per day, status, and uncertainty without false precision.
- Stockout Cost Calculator Audit Template: Audit availability, demand, substitution, recovery, contribution, costs, formula, approvals, monitoring, privacy, and rollback.
Next step: Open Seller Profit Guard.
This is operational planning help, not tax, accounting, legal, financial, or platform-policy advice. Review the Terms and disclaimer, and verify current platform rules and fee assumptions before changing prices.