Seller Profit Guard · How it works · CSV privacy
Safety stock calculator
Estimate safety-stock units for one SKU-location by combining daily-demand variation with replenishment lead-time variation, then multiplying lead-time demand standard deviation by a declared service-level z-score. The result is a rounded statistical buffer under entered assumptions—not a forecast, reorder point, purchase quantity, or stockout guarantee.
Maintained by Seller Profit Guard Editorial Team. Last reviewed: 2026-07-31.
Start with the safety-stock formula
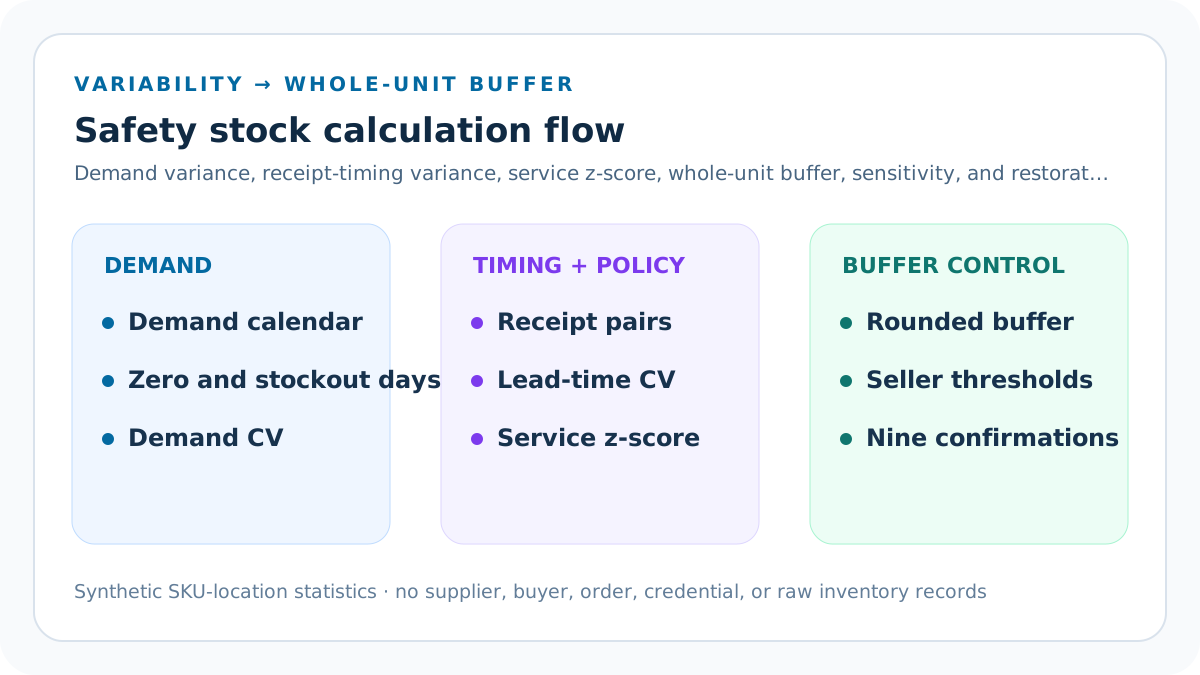
The statistical model combines daily-demand variance across average lead time with variance created by lead-time uncertainty. Take the square root of their sum to estimate lead-time demand standard deviation, multiply by the declared service-level z-score, and round the final buffer up to a whole unit.
The buffer is not expected lead-time demand.
Understand the two variance components
Demand variation contributes average lead time multiplied by daily-demand standard deviation squared. Lead-time variation contributes average daily demand squared multiplied by lead-time standard deviation squared.
Both components are measured in squared units before the square root.
Use population standard deviation consistently
The official NetSuite method divides demand squared deviations by calendar days in the analysis period and lead-time squared deviations by qualifying observations. The calculator expects standard deviations prepared on that population basis.
Do not mix sample and population formulas without documenting the change.
Include zero-demand calendar days
A demand series must preserve calendar days with zero qualifying demand. Dropping quiet days can inflate the average, alter variability, and make the buffer incomparable with the official method.
Mark stockout-suppressed days separately from genuine zero demand.
Calculate one SKU at one location
Demand, receipt performance, inventory policy, and buffer ownership can differ by location. Keep the calculation at one sellable SKU-location grain before any portfolio rollup.
A global average can hide a local supplier or fulfillment pattern.
Choose the service target explicitly
The calculator supports the official example mapping of 50, 90, 95, 98, 99, and 99.99 percent to z-scores 0.00, 1.28, 1.65, 2.05, 2.33, and 3.72. The service target must have an operational owner.
A higher target is not free inventory protection.
Read the consistent-lead-time scenario
Scenario A uses four average daily units, 1.50 units of daily-demand standard deviation, twelve average lead-time days, zero lead-time standard deviation, and a 95 percent target. The unrounded estimate is 8.57 units and the whole-unit buffer is nine.
Only demand variability contributes to this example.
Read the variable-lead-time scenario
Scenario B uses six average daily units, two units of daily-demand standard deviation, eighteen average lead-time days, three lead-time standard-deviation days, and a 98 percent target. Its combined standard deviation is 19.90 units and its rounded buffer is forty-one.
Supplier timing contributes most of the second scenario's variance.
Compare the result in days without replacing units
Dividing safety-stock units by average daily demand gives a descriptive equivalent: 2.25 days in Scenario A and 6.83 days in Scenario B. Keep the official output in units for inventory use.
Equivalent days are not a new lead-time input.
Separate the buffer from the reorder point
Safety stock absorbs modeled uncertainty. A reorder point normally adds expected demand during replenishment lead time to that buffer. Use the separate Reorder Point Calculator only after the safety-stock policy is reviewed.
Do not add lead-time demand twice.
Separate safety stock from order quantity
The buffer does not decide purchase quantity, vendor minimum, case pack, economic order quantity, shelf-life exposure, warehouse capacity, or cash approval.
When-to-order, how-much-to-order, and uncertainty protection are different jobs.
Treat service level as a policy input
The calculator converts an entered target to a z-score; it does not prove that the target is economically optimal, contractually required, or operationally achievable. Compare the target with carrying cost, lost-sale exposure, substitution, replenishment options, and service commitments.
Approval belongs outside the browser model.
Use receipt-derived lead time
Measure comparable order or recognition dates through usable receipts at the same location. Exclude canceled lines and explain quality holds, transfers, split receipts, expedited orders, and vendor changes.
A quoted supplier promise is not the same as observed usable lead time.
Require enough receipt observations
NetSuite documents that fewer than three qualifying lead-time values do not support its inventory-optimization calculation. This calculator blocks fewer than three receipt samples and displays the entered count.
More observations can still be unrepresentative if their scope is mixed.
Use a dated demand window
The demand window should cover a meaningful operating cycle while keeping product, location, channel, assortment, and availability definitions comparable. The calculator blocks fewer than twenty-eight days and reviews fewer than fifty-six.
A long stale window can be as misleading as a short noisy one.
Review intermittent demand
The normal-distribution approximation is weak when demand is intermittent, promotional, strongly seasonal, or skewed. The calculator returns Review when the seller declares those patterns.
Review means use sensitivity or a better planning method, not ignore the warning.
Review extreme variability
Demand standard deviation above average demand can signal many zero days, outliers, stockouts, product launches, or mixed records. Lead-time deviation above half the average can signal multiple suppliers, locations, transport modes, or receipt definitions.
Investigate the source before increasing inventory mechanically.
Read coefficients of variation
The enhanced packet divides daily-demand deviation by average daily demand and lead-time deviation by average lead time. Scenario A reports 37.50 percent demand variation and zero percent timing variation; Scenario B reports 33.33 percent and 16.67 percent.
These ratios describe relative dispersion; they do not prove a probability distribution or service outcome.
Apply seller-owned review thresholds
The seller records a minimum qualifying-receipt count for Ready and a maximum equivalent-buffer-days threshold. Falling below the evidence threshold or above the buffer-days threshold returns Review while preserving the arithmetic.
Thresholds are governance controls, not universal inventory rules.
Require two materially different scenarios
Scenario B must differ from Scenario A in demand, deviation, lead time, service target, evidence, receipt count, or pattern. Duplicate inputs are blocked because a copied comparison cannot expose a distinct operating condition.
Changing only a label or prose wrapper is not a second scenario.
Date the source and policy packet
Record a real source-review date and a policy-effective date that is not later than the source review. The dates establish what official rules and internal policy version the calculation used.
A changed date without refreshed evidence is not freshness.
Confirm all nine evidence controls
Before Ready, confirm SKU-location grain, calendar zero days, stockout treatment, usable-receipt definition, service mapping, population method, demand-pattern classification, aggregate privacy, and current platform or planning rules.
Any missing confirmation blocks derived outputs instead of exposing a plausible but unusable number.
Mask derived results on Block
When structural validation fails, the calculator displays Unavailable for z-scores, variance components, deviations, buffers, equivalent days, and variation ratios. This prevents invalid arithmetic from being copied into a planning system.
The issue list remains visible so the packet can be corrected and rerun.
Do not infer demand lost during stockouts
Observed sales while unavailable understate potential demand, but this calculator does not reconstruct unconstrained demand. Flag the affected days, document the treatment, and test a bounded alternative rather than silently replacing them.
No sales correction should be hidden.
Preserve intermediate values
Record both variance components, combined lead-time demand standard deviation, z-score, unrounded buffer, rounded buffer, and equivalent days. Intermediate values show whether demand or receipt timing drives the result.
A single whole-unit output is not a reproducible policy.
Run sensitivity before approval
Recalculate with an adjacent supported service level, an alternative comparable demand window, and a justified lead-time sample. Compare units, equivalent days, carrying implications, and later error.
Sensitivity exposes model dependence; it does not select the winning policy.
Classify Block, Review, and Ready
Block covers invalid amounts, unsupported service targets, insufficient demand or receipt evidence, missing scope, broken statistical context, or open conflicts. Review covers weak distribution shape or extreme variability. Ready means only that the entered statistical packet is internally complete.
No state authorizes a purchase.
Keep demand and receipts private
Use aggregate synthetic values in the public tool. Keep raw SKU transactions, stockout logs, purchase orders, supplier identities, receipt records, customer orders, addresses, credentials, and buyer data in authorized systems.
The calculator neither uploads nor persists source rows.
Document the policy owner
Record who owns the service target, demand definition, stockout treatment, lead-time definition, location scope, calculation version, effective date, monitoring window, and restoration value.
A buffer without ownership becomes an unexplained inventory number.
Monitor forecast and receipt error separately
After release, compare actual demand variability and lead-time variability with the assumptions. Track threshold crossings, emergency replenishment, expirations, carrying exposure, and stockouts without treating one quiet period as causal proof.
Separate demand error from supplier-timing error.
Restore the prior buffer when evidence breaks
Retain the prior accepted safety-stock value, alert or planning configuration, approver, and effective period. Define stop rules for corrupted demand, mixed locations, supplier changes, missing receipts, or material distribution shifts.
A reversible policy is safer than an irreversible overwrite.
Use the formula guide for implementation
The formula and inputs guide explains units, population standard deviations, evidence definitions, supported z-scores, rounding, and example calculations.
Use the parent tool for deterministic arithmetic and the guide for evidence design.
Use the examples to audit arithmetic
The stable and variable-lead-time examples expose every component. Recompute nine and forty-one units independently before adapting the method to private data.
Synthetic fixtures are test evidence, not inventory advice.
Use the source guide for field lineage
Map daily demand, zero days, stockouts, order dates, usable receipts, service target, and location keys to authoritative system fields. Preserve protected pointers rather than public raw rows.
A report name alone is not field-level lineage.
Use the decision guide before operations
The decision guide separates statistical validity, policy approval, carrying constraints, reorder-point integration, monitoring, and rollback. Ready from the tool enters those gates; it does not bypass them.
Inventory consequences require human ownership.
Interpret the result narrowly
The output estimates a buffer under the declared normal-distribution model. It cannot forecast demand, optimize service, prove inventory accuracy, choose purchasing quantities, guarantee delivery, prevent stockouts, or establish accounting treatment.
State these boundaries beside every operational use.
Release pages only after quality gates
Before indexing, validate official sources, direct answers, originality, cross-page similarity, schema, metadata, images, links, mobile controls, strict routes, backups, deployment, and live behavior.
Search signals are measured later but do not replace quality review.
Refresh the calculation when inputs change
Recalculate after a material product, location, assortment, stockout, promotion, supplier, transport, receipt-definition, service-target, or planning-policy change. Keep the old and new packet side by side.
Freshness comes from evidence, not an automatically changed date.
Sources and further reading
- NetSuite Help: Inventory Optimization Calculations: Official average-demand, standard-deviation, service-level z-score, safety-stock, rounding, and approximation rules.
- NetSuite Help: Inventory Optimization: Official item-location inventory-optimization scope, demand history, lead-time history, service-level, and planning-value behavior.
- NetSuite Help: Lead Time and Safety Stock Per Location: Official location-specific lead-time, receipt-history, and safety-stock behavior.
- NetSuite Help: Inventory Count: Official inventory-count workflow supporting the boundary between a statistical buffer and verified on-hand inventory.
- Microsoft Learn: Safety stock fulfillment for items: Official planning example showing a safety-stock quantity as a minimum inventory threshold.
- Microsoft Learn: Planning parameter best practices: Official guidance distinguishing safety-stock quantity from safety lead time and describing appropriate operational uses.
- Microsoft Learn: Planning parameters: Official separation of safety-stock quantity, safety lead time, reorder timing, quantity, and order modifiers.
- Seller Profit Guard methodology: Evidence, formula, privacy, correction, release, monitoring, and rollback rules.
- Seller Profit Guard data privacy: Local-first boundaries for SKU, supplier, receipt, order, buyer, and raw inventory data.
Related Seller Profit Guard tools
- Etsy CSV profit calculator: Run a local order profit check with editable fee and SKU cost assumptions.
- Payment reconciliation tool: Compare order rows with statement activity and flag unmatched rows.
- SKU cost library: Save or import material, labor, packaging, shipping, and target margin assumptions.
- Variant risk checker: Find missing SKUs and variation cost risks before a listing scales.
- Etsy title checker: Review listing-title clarity, repetition, keyword chains, and mobile scanning.
- Etsy tag checker: Review all 13 tag slots for duplicates, repeated meaning, and truthful coverage.
- Free shipping threshold calculator: Estimate when a shipping subsidy can still meet a target margin.
- Return window loss estimator: Model expected reverse shipping, restock work, recovery, and replacement loss.
- Etsy Ads break-even calculator: Estimate target-safe Etsy Ads spend, ACOS, and ROAS after fees, fulfillment, and expected return loss.
- CSV data privacy: Understand what the local-first workflow needs and what it does not need.
- Safety Stock Formula and Input Rules: Define SKU-location demand, variability, lead-time samples, service z-scores, population formulas, evidence windows, and rounding.
- Safety Stock Worked Example: Stable Lead Time: Calculate a nine-unit buffer from four daily units, 1.50 demand deviation, twelve-day lead time, zero timing deviation, and 95% service.
- Safety Stock Example with Variable Lead Time: Calculate a 41-unit buffer when six-unit demand, demand deviation, receipt timing deviation, and a 98% service target interact.
- Safety Stock Mistakes and Corrections: Correct missing zero days, stockout bias, mixed SKU locations, sample-vs-population errors, weak receipt pairs, z-score misuse, and double buffers.
- Safety Stock Data Sources and Lineage: Map demand calendars, stockouts, order-to-receipt pairs, locations, service targets, formula versions, and policy approvals to authoritative fields.
- Safety Stock Decision and Approval Gates: Separate population validity, statistical fit, service ownership, capacity, carrying exposure, replenishment integration, monitoring, and rollback.
- Stable vs Variable Lead-Time Safety Stock: Compare nine-unit and 41-unit buffers at the same SKU-location grain and isolate demand, receipt-timing, and service-target drivers.
- Weekly Safety Stock Review Routine: Run a repeatable SKU-location cycle for demand calendars, stockouts, receipt pairs, deviations, service policy, sensitivity, exceptions, and restoration.
- How to Interpret Safety Stock Results: Read variance components, combined deviation, z-score, rounded units, equivalent days, and status without claiming optimal service or protection.
- Safety Stock Audit and Change Log: Audit population scope, demand calendars, stockouts, receipt pairs, deviations, service policy, sensitivity, approval, monitoring, and rollback.
Use the interactive tool
Enable JavaScript to open the calculator and process browser-local inputs. The explanatory content and source links remain available without JavaScript.
Related guide: Define demand and lead-time variability, population standard deviations, supported service targets, evidence, assumptions, and rollback.
This tool provides operating estimates, not tax, accounting, legal, financial, or marketplace-policy advice. Verify current official sources and your own records before changing prices or operations.