Seller Profit Guard · How it works · CSV privacy
Reorder point calculator
Calculate when one SKU-location should reach a replenishment threshold by adding seasonally adjusted lead-time demand to safety stock. Compare the result with reconciled inventory position, demand-evidence cycles, a seller-owned safety-stock-share limit, and nine dated confirmations before estimating a trigger date. The result is a planning review, not a purchase order, forecast, or stockout guarantee.
Maintained by Seller Profit Guard Editorial Team. Last reviewed: 2026-07-31.
Start with the reorder-point formula
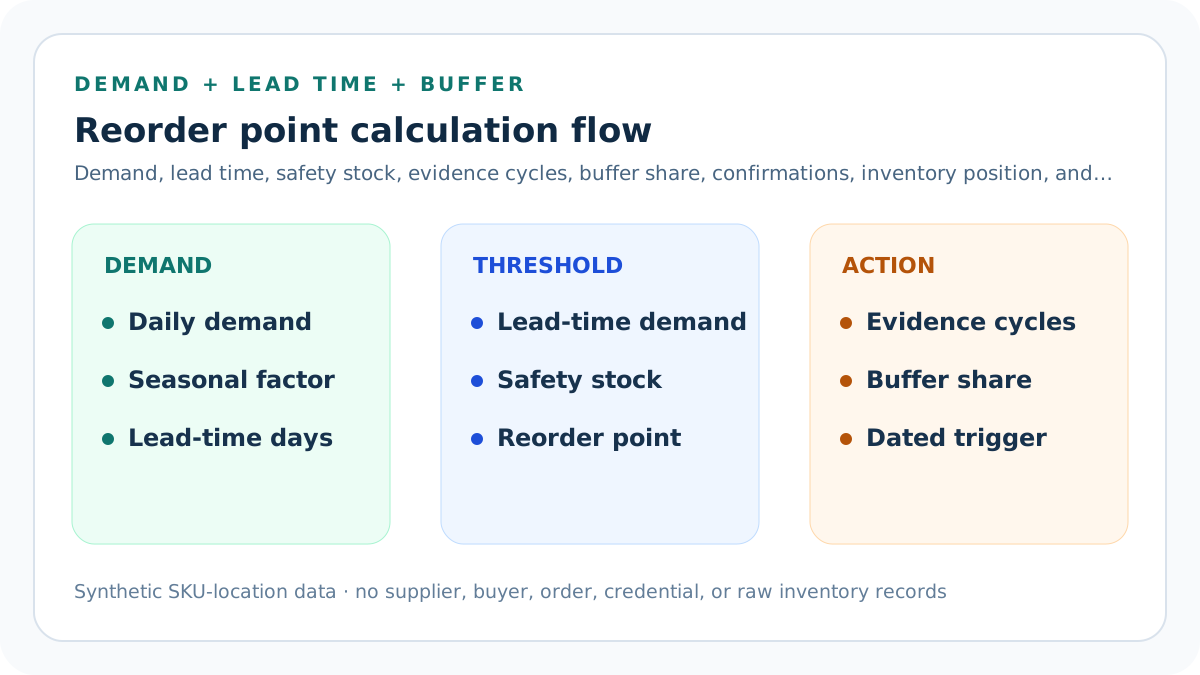
Reorder point equals expected demand during replenishment lead time plus a separately approved safety-stock quantity. The calculator multiplies demand by a seasonality factor, extends that adjusted daily rate across lead time, adds safety stock, and rounds the threshold up to a whole unit.
This is a trigger threshold, not an order quantity.
Keep one SKU-location grain
Demand, on hand, inbound units, commitments, lead time, and safety stock must describe the same SKU at the same inventory location. Combining warehouse stock with shop demand or mixing parent products with variants makes the threshold internally inconsistent.
Location-level evidence prevents false availability.
Measure daily demand deliberately
Scenario A accepts average daily units directly. Use a dated sales or consumption window that represents the SKU-location cycle, then document exclusions such as stockout days, one-time bulk orders, test transactions, or discontinued channels.
The tool does not infer demand from private order data.
Convert monthly demand consistently
Scenario B divides entered recent monthly units by thirty before applying seasonality. This transparent convention supports a worked comparison, but a seller with daily history should calculate a dated daily rate from the authoritative inventory or sales system.
Month length and stockout distortion remain external evidence questions.
Use receipt-based lead time
Lead time should cover the elapsed days from recognizing or placing replenishment to usable receipt at the reviewed location. Oracle and NetSuite documentation distinguish replenishment lead time, and NetSuite can derive location lead time from purchase-order and receipt records.
A promised supplier average is weaker than dated receipts.
Keep safety stock separate
Safety stock is a buffer for demand or supply variation. Adding it separately makes the model reviewable: lead-time demand covers expected consumption, while safety stock represents the seller's chosen protection against uncertainty.
The calculator does not optimize service level or buffer cost.
Apply seasonality as a scenario
A multiplier of 1.00 keeps the observed daily rate unchanged. A value above 1.00 models a higher demand period; below 1.00 models a lower period. The multiplier needs an event window and comparable evidence rather than a guess copied across all SKUs.
Seasonality is an assumption, not a forecast.
Build inventory position
The model defines inventory position as on-hand units plus entered inbound units due within lead time minus committed or backordered units. This prevents physically present but already promised stock from being counted as free inventory.
Allocated, damaged, quarantined, or transfer stock may need separate treatment.
Treat inbound timing cautiously
An aggregate inbound value is added at the review date for this simple model. If receipts arrive after the projected threshold or in several partial deliveries, a time-phased plan is required. Any positive aggregate inbound therefore moves the packet to Review.
A single total cannot prove availability by day.
Calculate trigger headroom
Headroom equals inventory position minus reorder point. Positive headroom means the entered position is above the threshold; zero or negative headroom means the threshold is reached under the model.
Headroom is inventory units, not days or purchase value.
Estimate days to trigger
When headroom is positive, divide it by adjusted daily demand and round up. The trigger date adds those days to the entered review date. This straight-line projection assumes the same daily rate and does not schedule individual sales or receipts.
Use time-phased planning for lumpy demand and supply.
Read the stable scenario
The default stable scenario uses four units per day, twelve lead-time days, eighteen safety-stock units, eighty-five on hand, zero inbound, and five committed. Lead-time demand is forty-eight, reorder point is sixty-six, inventory position is eighty, and the trigger is four days after review.
The example is synthetic and reproducible.
Read the seasonal scenario
The seasonal example starts with 180 units per thirty days, an 18-day lead time, 30 safety-stock units, and a 1.40 multiplier. Adjusted demand is 8.40 units per day, lead-time demand is 151.20, and the rounded reorder point is 182 units.
The multiplier must be sourced before operational use.
Separate threshold from purchase quantity
Crossing a reorder point answers when to review or replenish. It does not answer how much to buy. Supplier minimums, case packs, order multiples, target stock, carrying cost, shelf life, cash constraints, and open purchase orders belong to an order-quantity decision.
Do not turn the result into an automatic PO.
Separate on hand from available
Microsoft documents projected inventory and projected available inventory as distinct planning concepts. Reservations, allocations, and commitments can reduce what is available even when gross stock appears sufficient.
Reconcile the exact inventory field used by the source system.
Separate trigger date from delivery date
The calculated trigger date is the projected date the inventory position reaches the threshold. It is not the supplier receipt date, stockout date, or promise date. Lead time is already embedded in the threshold.
Label dates precisely in operating reports.
Avoid mixed location data
Supplier lead time, safety stock, on hand, and demand can differ by location. NetSuite specifically documents location-level lead-time and safety-stock behavior. Model each replenishment location separately before rolling up an aggregate view.
Transfers need their own timing and availability evidence.
Account for stockout-distorted history
Sales during a stockout can understate demand because buyers could not purchase. Shopify's low-stock reporting uses a selectable sample period, illustrating why the demand window matters. Record stockout days and consider a corrected planning rate outside this simple calculator.
Do not invent lost demand.
Use complete commitments
Subtract units already promised through open orders, backorders, allocations, wholesale reservations, or other approved demand at the same grain. If commitment data is incomplete, Block the packet rather than presenting gross on hand as usable.
Private order rows stay outside public content.
Use complete inbound evidence
Include only purchase orders or transfers expected to become usable at the reviewed location within the declared lead-time horizon. Exclude unapproved, undated, disputed, cancelled, or quality-held supply.
An open order number alone is not receipt evidence.
Count evidence in lead-time cycles
Divide the demand-evidence window by the scenario lead time. Thirty days across a twelve-day lead time is 2.50 cycles; ninety days across an eighteen-day lead time is 5.00 cycles. The seller enters a minimum cycle threshold, and a scenario below it moves to Review rather than silently appearing complete.
Cycle coverage is a seller review control, not a universal statistical rule.
Expose the safety-stock share
Divide safety stock by the final rounded reorder point. The stable example uses 18 ÷ 66, or 27.27%; the seasonal example uses 30 ÷ 182, or 16.48%. Compare the result with a seller-owned maximum share to reveal when the buffer dominates the threshold.
A high share needs policy review; it is not automatically wrong.
Date the evidence and policy
Keep the inventory review date, official-source review date, and reorder-policy effective date distinct. The policy cannot become effective after the supporting source review, and the inventory packet cannot claim evidence from a future review date.
Real calendar validation blocks impossible dates such as February 30.
Confirm nine evidence controls
Explicitly confirm one SKU-location demand grain, receipt-derived lead time, separate safety-stock approval, dated seasonality evidence, reconciled inventory position, inbound timing, complete commitments, aggregate privacy, and current platform or planning rules.
A missing confirmation blocks derived outputs rather than presenting provisional arithmetic as usable.
Require two distinct scenarios
The stable daily-demand case and seasonal monthly-demand case must differ after normalization in at least one supported demand, lead-time, buffer, seasonality, inventory, commitment, inbound, or evidence input.
Duplicating a worksheet under a new label is not comparison evidence.
Mask blocked calculations
If a structural field, real date, threshold, confirmation, scope, context, numeric input, or declared conflict fails, the interface returns Block and masks calculated demand, threshold, position, headroom, cycle, share, and trigger outputs.
Unavailable is safer than a precise-looking result built on invalid evidence.
Read Block, Review, and Ready
Block covers invalid dates, demand, lead time, safety stock, inventory values, evidence, scope, or open conflicts. Review covers short demand history, unusually large seasonality, or aggregate inbound timing. Ready clears the entered simple model.
No decision connects to a warehouse or supplier.
Refresh after material changes
Recalculate after a supplier lead-time change, price-independent demand shift, location transfer, commitment correction, stock count, inbound delay, assortment change, or safety-stock policy update.
Preserve the prior packet for comparison.
Monitor forecast error without claiming proof
Compare projected trigger dates and lead-time demand with later observed consumption, receipt timing, and threshold crossings. Record absolute and directional error by SKU-location, but do not treat one accurate period as proof of a permanent demand process.
Measurement should improve the next assumption.
Protect private operations data
Use synthetic values and aggregate counts in public explanations. Keep item-level sales exports, supplier agreements, purchase orders, customer orders, addresses, credentials, and private warehouse data in their authorized systems.
The browser-local fields are not a data warehouse.
Preserve rollback and approval
A threshold change should retain the prior demand rate, lead time, safety stock, inventory definition, approver, effective date, alert configuration, monitoring plan, and restoration value.
Reversible policy changes are easier to audit.
Interpret the result narrowly
The calculator proves only the arithmetic under entered aggregate assumptions. It cannot forecast demand, choose a service level, optimize safety stock, guarantee delivery, prevent a stockout, calculate economic order quantity, or place a purchase order.
Operational judgment and source-system reconciliation remain required.
Use the related guides
The support cluster separates formula design, two worked scenarios, data evidence, failure repair, decision gates, comparison, weekly control, result interpretation, and an audit template. Use the parent calculator for arithmetic and the relevant guide for the operating decision.
Each guide answers a distinct replenishment task.
Release and monitor safely
Before indexing, validate sources, direct answer, originality, similarity, schema, static SEO, images, links, mobile controls, strict 404 behavior, backups, deployment, targeted purge, and live routes. Measure delayed discovery without manufacturing traffic or ad interactions.
Search signals do not replace the quality gate.
Sources and further reading
- Shopify Help: Low stock: Official lead-time and sales-per-day reorder-point example, depletion context, and Stocky retirement notice.
- Microsoft Learn: Handling reordering policies: Official projected-inventory, lead-time demand, safety-stock, time-bucket, and reordering-policy boundaries.
- Microsoft Learn: Reordering policy best practices: Official boundary between when to replenish, how much to replenish, and order modifiers.
- NetSuite Help: Lead Time and Safety Stock Per Location: Official item-location lead-time and safety-stock context.
- NetSuite Help: Inventory Optimization: Official item-location demand history, service-level, and lead-time variability context.
- Microsoft Learn: Inventory Availability report: Official on-hand, expected supply, demand, purchase-order, transfer, and SKU availability boundaries.
- Square Support: Create inventory alerts: Official behavior for location-level low-stock thresholds and alerts.
- Seller Profit Guard methodology: Evidence, formula, privacy, correction, release, and rollback rules.
- Seller Profit Guard data privacy: Local-first boundaries for inventory, supplier, order, buyer, and raw catalog data.
Related Seller Profit Guard tools
- Etsy CSV profit calculator: Run a local order profit check with editable fee and SKU cost assumptions.
- Payment reconciliation tool: Compare order rows with statement activity and flag unmatched rows.
- SKU cost library: Save or import material, labor, packaging, shipping, and target margin assumptions.
- Variant risk checker: Find missing SKUs and variation cost risks before a listing scales.
- Etsy title checker: Review listing-title clarity, repetition, keyword chains, and mobile scanning.
- Etsy tag checker: Review all 13 tag slots for duplicates, repeated meaning, and truthful coverage.
- Free shipping threshold calculator: Estimate when a shipping subsidy can still meet a target margin.
- Return window loss estimator: Model expected reverse shipping, restock work, recovery, and replacement loss.
- Etsy Ads break-even calculator: Estimate target-safe Etsy Ads spend, ACOS, and ROAS after fees, fulfillment, and expected return loss.
- CSV data privacy: Understand what the local-first workflow needs and what it does not need.
- Reorder Point Formula and Input Rules: Define SKU-location demand, lead time, safety stock, inventory position, seasonality, evidence, and trigger-date assumptions.
- Reorder Point Worked Example: Stable Demand: Calculate a 66-unit reorder point and dated trigger for a stable SKU with four daily units, twelve lead-time days, and safety stock.
- Seasonal Reorder Point Worked Example: Convert monthly demand, apply a 1.40 seasonal factor, and calculate a 182-unit threshold for a longer replenishment lead time.
- Reorder Point Mistakes That Cause Stockouts: Correct mixed locations, sales-window bias, missing commitments, false inbound, stale lead time, double-counted buffers, and wrong date labels.
- Reorder Point Data Sources and Evidence: Source SKU-location demand, stockouts, receipts, safety stock, on hand, inbound, commitments, supplier rules, and inventory policy evidence.
- Reorder Point Decision and Release Gates: Separate data-validity, model, trigger, time-phased receipt, purchasing, approval, monitoring, rollback, and exception gates.
- Stable vs Seasonal Reorder Points Compared: Compare a 66-unit stable threshold with a 182-unit seasonal threshold at one SKU-location, evidence, and inventory-position grain.
- Weekly Reorder Point Review Routine: Run a repeatable SKU-location review for counts, commitments, receipts, demand windows, safety stock, alerts, exceptions, and restoration.
- How to Interpret Reorder Point Results: Read lead-time demand, safety stock, inventory position, headroom, trigger days, and status without claiming forecast or order proof.
- Reorder Point Audit and Change Log: Audit SKU-location grain, demand, lead time, safety stock, inventory position, trigger, purchasing action, monitoring, and restoration.
- How do you allocate limited inventory across channels?: Reconcile one physical whole-unit SKU pool, exclude unavailable and protected reserve units, and estimate every channel on the same forecast horizon. Give each channel a demand-capped service floor, then allocate remaining units either equally or by contribution per retained unit. Compare projected contribution, unmet demand, evidence, and restoration before any live change.
- What is a complete equal inventory allocation example?: An invented SKU has 300 physical units, 30 protected reserve units, and 270 allocatable units. Three channels demand 150, 120, and 100 units with 40-unit floors. After floors, the remaining 150 units are distributed evenly, producing 90 units per channel, 100 unmet units, and USD 4,050 projected contribution.
Use the interactive tool
Enable JavaScript to open the calculator and process browser-local inputs. The explanatory content and source links remain available without JavaScript.
Related guide: Define SKU-location grain, demand, lead time, safety stock, inventory position, trigger-date assumptions, evidence, and rollback.
This tool provides operating estimates, not tax, accounting, legal, financial, or marketplace-policy advice. Verify current official sources and your own records before changing prices or operations.