Seller Profit Guard · How it works · CSV privacy
Inventory carrying cost calculator
Estimate annual inventory carrying cost by adding capital, storage, insurance and inventory tax, shrink, obsolescence, and carrying-related administration costs, then divide by average inventory value to calculate the carrying rate. The result is an operating estimate under entered assumptions—not inventory valuation, COGS, tax treatment, an optimal stock level, or a purchase decision.
Maintained by Seller Profit Guard Editorial Team. Last reviewed: 2026-07-31.
Start with the carrying-cost formula
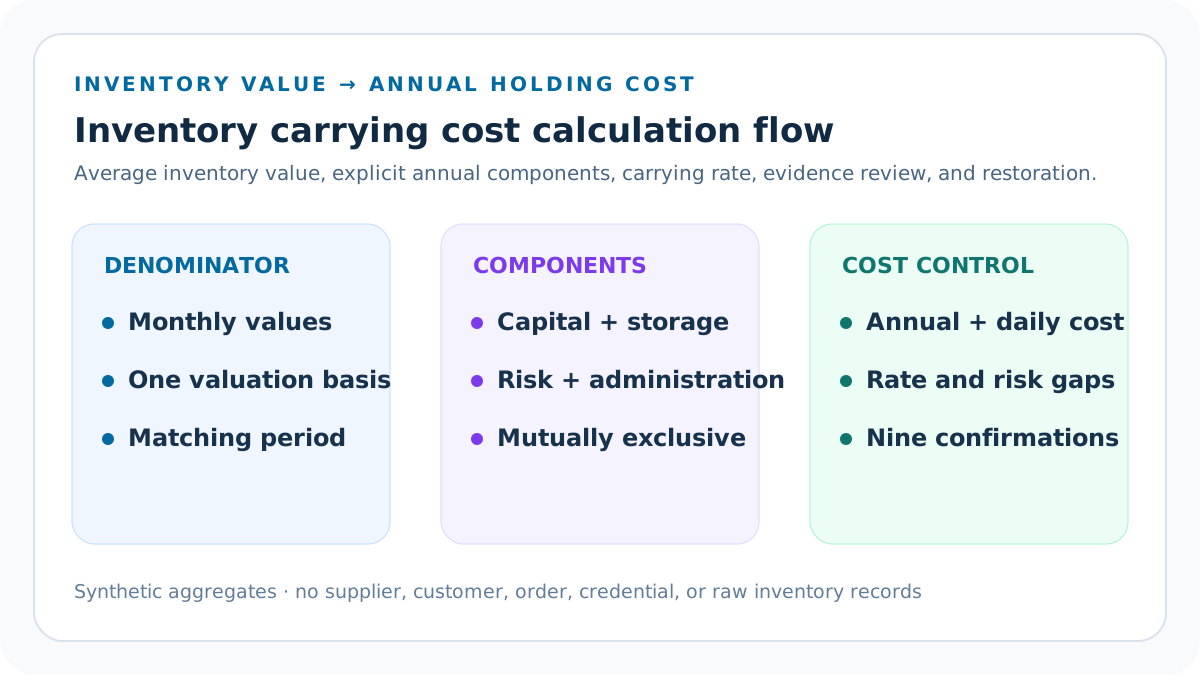
Add annual capital, storage, insurance and inventory tax, shrink and inventory loss, obsolescence, and carrying-related administration costs. Divide that total by average inventory value on the same valuation basis to calculate the annual carrying rate.
Keep every component and the denominator visible.
Use average inventory value as the denominator
GAO expresses holding cost as a percentage of average on-hand inventory value. Use a documented monthly average, time-weighted average, or another consistent method rather than one convenient ending balance.
A point-in-time balance can distort a seasonal portfolio.
Measure the capital component
Capital cost represents the value of money tied up in inventory. Use a documented seller-approved annual capital charge or explicit financing cost applied consistently to average inventory investment.
Do not silently substitute gross margin or expected return.
Measure storage without double counting
Include warehouse rent or allocation, utilities, equipment, occupancy, and storage services only to the extent they support the declared inventory population and are not already counted elsewhere.
Allocation keys need an owner and period.
Separate insurance and inventory taxes
Record only insurance and inventory-tax amounts that belong to the modeled inventory scope. Keep sales tax, income tax, marketplace tax collection, and unrelated business insurance outside the field.
Tax treatment requires professional review.
Estimate shrink and inventory losses
Use reconciled count adjustments, theft, damage, unexplained loss, and other inventory losses under one approved definition. Net recoveries or credits consistently and document unusual incidents.
A plug entry is not reliable evidence.
Estimate obsolescence and write-offs
Include expired, degraded, defective, discontinued, technologically obsolete, or otherwise unsellable inventory losses when they belong to the evidence period and population.
Do not wait for disposal to notice aging exposure.
Bound administration cost
Include cycle counting, inventory control, storage-related systems, and directly attributable administration only when the allocation is supportable. Exclude general selling work and order-variable fulfillment already modeled elsewhere.
Avoid turning every overhead line into carrying cost.
Read the fast-moving scenario
Scenario A uses average inventory value of USD 25,000 and annual components totaling USD 4,750. The carrying rate is 19.00 percent and the monthly equivalent is USD 395.83.
The synthetic result is arithmetic evidence, not a benchmark.
Read the slow-moving scenario
Scenario B uses average inventory value of USD 60,000 and annual components totaling USD 19,800. Its carrying rate is 33.00 percent and monthly equivalent is USD 1,650.
Obsolescence and shrink are materially larger in this fixture.
Compare rates only after normalizing scope
The 19 and 33 percent rates are comparable only because both examples use annual costs, one currency, the same component taxonomy, and a consistent average-inventory denominator.
Different valuation bases invalidate a rate comparison.
Do not treat a historical percentage as a universal benchmark
GAO reported holding-cost rates for particular government inventory systems and periods. Those figures support the definition and denominator, not a current target for an independent seller.
The calculator uses seller-entered evidence and threshold.
Separate carrying cost from inventory value
Inventory value is the denominator in this operating model. Carrying cost is the incremental annual burden of holding that value under declared components.
Adding both together as one cost layer would double count.
Separate carrying cost from COGS
Cost of goods sold concerns the cost assigned to goods sold under an accounting method. Carrying cost estimates the annual burden of keeping average inventory on hand.
Accounting classification can differ from an operating analysis.
Separate the model from tax capitalization
IRS rules determine when direct and indirect costs are capitalized, deducted, or recovered through COGS. This calculator does not apply section 263A, exemptions, or jurisdiction-specific rules.
Use an accountant for books and tax filings.
Separate the model from order quantity
A carrying rate can inform order-quantity analysis, but this tool does not balance ordering cost, demand, price breaks, service requirements, supplier minimums, or shelf life.
It does not calculate EOQ.
Choose a complete evidence period
Twelve months captures seasonal storage, insurance, write-offs, and count adjustments more reliably than a short window. Shorter periods should be annualized transparently and returned as Review.
Never annualize one unusual month without disclosure.
Align cost recognition with the denominator
If average inventory covers a twelve-month portfolio, annual costs must cover the same portfolio and period. Acquisitions, closures, new warehouses, or category changes require a bridge.
Mismatched periods manufacture rate changes.
Avoid duplicate warehouse allocations
Storage services may appear in rent, fulfillment invoices, landed cost, overhead, or per-order handling. Map each source once and state the exclusion rule.
The component ledger should reconcile to its source accounts.
Avoid duplicate loss recognition
Do not include the same damaged unit in shrink, obsolescence, expected returns, and product cost. Assign one primary category and retain a cross-reference.
Rate completeness does not justify duplication.
Keep recoveries and credits visible
Insurance proceeds, supplier credits, liquidation proceeds, carrier claims, and recovered stock can reduce a component only under a documented net or gross policy.
Do not mix gross costs in one period with net costs in another.
Use a declared review threshold
The seller-entered threshold marks a packet for review; it does not establish an optimal or industry-standard rate. The default 25 percent makes Scenario B Review while Scenario A clears that one test.
A threshold is a control, not a verdict.
Date the source and carrying policy
Record a real official-source review date and a policy-effective date that is not later than that review. These dates identify the external rules and internal component definitions used by the packet.
Changing a date without refreshing the sources and evidence is not a substantive update.
Require two materially different scenarios
The comparison must differ in average inventory value, component amounts, or evidence months. A copied second scenario is blocked because it cannot test another inventory profile, allocation, or risk mix.
Renaming identical numbers does not create independent evidence.
Set a minimum evidence-month threshold
The declared YYYY-MM range has an inclusive month count, and each scenario must match it. The seller separately chooses how many months are required for Ready; a shorter valid period returns Review.
This separates structural period integrity from a governance threshold.
Set a maximum risk-component share
Combine insurance and inventory tax, shrink and loss, and obsolescence, then divide by annual carrying cost. The seller-entered maximum marks a scenario for Review when risk-related components dominate the pool.
A high share calls for source and operating review, not automatic liquidation.
Read daily cost and threshold gaps
The enhanced packet reports annual cost divided by 365 and carrying-rate percentage points above or below the seller threshold. Scenario A is USD 13.01 daily and 6.00 points below; Scenario B is USD 54.25 daily and 8.00 points above.
Daily equivalents describe the annual model and do not reproduce cash timing.
Confirm nine evidence controls
Confirm average-value basis, annualization, mutually exclusive components, capital evidence, storage evidence, risk evidence, administration evidence, aggregate privacy, and accounting or tax boundaries.
A missing yes blocks the packet instead of displaying plausible derived totals.
Mask derived results on Block
When dates, values, periods, scope, scenarios, thresholds, confirmations, or conflicts fail, the calculator displays Unavailable for inventory value, totals, rates, shares, daily and monthly equivalents, and threshold gaps.
The visible issue list guides correction without leaking an unusable number into planning.
Investigate drivers before cutting stock
A high rate may reflect obsolete stock, expensive storage, capital constraints, poor valuation, a one-time loss, or allocation error. Diagnose the component before choosing liquidation, purchasing, storage, or assortment changes.
Rate reduction is not automatically profit improvement.
Protect service and stockout outcomes
Lower average inventory may reduce carrying cost but can increase stockouts, expediting, split shipments, lost sales, and supplier risk. Evaluate those effects in separate models.
One cost measure cannot optimize the system.
Classify Block, Review, and Ready
Block covers invalid amounts, inconsistent scope, missing valuation context, malformed periods, open conflicts, or unusable evidence. Review covers short windows, rates above the declared threshold, or costs above average inventory value.
Ready means only that the entered packet is internally complete.
Keep private records out of the public page
Use synthetic aggregates in the calculator. Keep SKU balances, warehouse invoices, supplier identities, write-off detail, customer orders, addresses, credentials, and buyer data in authorized systems.
The browser model does not upload source rows.
Preserve a component ledger
Record source, account or report, field, transformation, allocation key, currency, period, owner, evidence timestamp, exception, and prior accepted value for each component.
A total without lineage is not auditable.
Run sensitivity by component
Change capital rate, storage allocation, shrink, and obsolescence one at a time. Keep the denominator fixed, then test a separate denominator scenario.
Sensitivity reveals model dependence, not causal certainty.
Monitor inventory age and turns separately
Carrying cost, inventory age, turns, days on hand, stockouts, service, markdowns, and write-offs answer different questions. Track them together without collapsing them into one score.
A low rate can coexist with poor availability.
Preserve the prior accepted model
Keep the previous denominator, component ledger, formula version, threshold, owner, and effective period. Define restoration triggers for broken mappings, duplicated allocations, stale valuation, or corrected loss records.
A reversible estimate is safer than an overwritten one.
Use the support guides for implementation
The formula, examples, mistake register, source map, decision gates, comparison, routine, interpretation, and audit guides provide separate evidence artifacts around the deterministic tool.
Each page has a distinct search and operational job.
Release only after full quality gates
Validate direct answers, official sources, originality, cross-page similarity, schema, metadata, images, internal links, mobile controls, strict routes, backups, build, deployment, and live behavior before indexing.
Search signals are measured later but are not a substitute for page quality.
Sources and further reading
- NetSuite Help: Inventory Turnover Report: Official average inventory value method using month-end on-hand values, plus turnover and days-on-hand boundaries.
- Oracle Inventory Optimization User's Guide: Official statement that average inventory level is often used to calculate inventory carrying cost.
- NetSuite Help: Setting Inventory Costing Preferences: Official evidence that costing methods, schedules, and negative-inventory treatment affect inventory values separately from this operating model.
- NetSuite Help: Inventory Items: Official boundary among inventory quantity, inventory value, COGS, income, locations, and transaction updates.
- IRS Publication 538: Accounting Periods and Methods: Official tax inventory valuation and accounting-method boundary; this calculator does not apply those rules.
- IRS Publication 583: Starting a Business and Keeping Records: Official recordkeeping guidance for inventory-cost and expense documentation.
- GAO: Defense Inventory—Applying Commercial Purchasing Practices: Primary government source defining investment, storage, obsolescence, and inventory-loss components and expressing holding cost as a percentage of average on-hand inventory value.
- GAO: Greater Use of Commercial Distribution Systems: Primary government source documenting annual inventory carrying-cost treatment and the importance of obsolescence.
- Oracle E-Business Suite: Materials Management: Official source describing cash tied up in carrying costs and write-off exposure from defects, degradation, and obsolescence.
- Microsoft Learn: Managing inventory costs: Official boundary for inventory valuation, cost methods, general-ledger posting, and cost of goods sold.
- IRS Publication 551: Basis of Assets: Official warning that tax capitalization and inventory-cost treatment follow separate rules and exceptions.
- IRS Publication 334: Tax Guide for Small Business: Official distinction among ending inventory, cost of goods sold, manufacturing overhead, and other business expenses.
- Seller Profit Guard methodology: Evidence, formula, privacy, correction, release, monitoring, and rollback rules.
- Seller Profit Guard data privacy: Local-first boundaries for SKU, supplier, inventory, expense, buyer, order, and raw export data.
Related Seller Profit Guard tools
- Etsy CSV profit calculator: Run a local order profit check with editable fee and SKU cost assumptions.
- Payment reconciliation tool: Compare order rows with statement activity and flag unmatched rows.
- SKU cost library: Save or import material, labor, packaging, shipping, and target margin assumptions.
- Variant risk checker: Find missing SKUs and variation cost risks before a listing scales.
- Etsy title checker: Review listing-title clarity, repetition, keyword chains, and mobile scanning.
- Etsy tag checker: Review all 13 tag slots for duplicates, repeated meaning, and truthful coverage.
- Free shipping threshold calculator: Estimate when a shipping subsidy can still meet a target margin.
- Return window loss estimator: Model expected reverse shipping, restock work, recovery, and replacement loss.
- Etsy Ads break-even calculator: Estimate target-safe Etsy Ads spend, ACOS, and ROAS after fees, fulfillment, and expected return loss.
- CSV data privacy: Understand what the local-first workflow needs and what it does not need.
- Inventory Carrying Cost Formula and Inputs: Define average inventory value, annual capital, storage, insurance, shrink, obsolescence, administration, carrying rate, and evidence rules.
- Inventory Carrying Cost Worked Example: Calculate USD 4,750 annual carrying cost and a 19% rate for fast-moving inventory with explicit capital, storage, loss, and aging inputs.
- Inventory Carrying Cost for Slow-Moving Stock: Calculate USD 19,800 annual carrying cost and a 33% rate for slow-moving inventory with higher storage, loss, and obsolescence exposure.
- Inventory Carrying Cost Mistakes: Correct ending-balance denominators, period mismatch, duplicate costs, hidden loss netting, unsupported capital rates, and accounting confusion.
- Inventory Carrying Cost Data Sources: Map average inventory values, capital assumptions, warehouse costs, insurance, losses, write-offs, and administration to authoritative evidence.
- Inventory Carrying Cost Decision Gates: Separate arithmetic readiness from valuation, allocation, threshold, service, cash, accounting, approval, monitoring, and rollback gates.
- Fast vs Slow Inventory Carrying Cost: Compare 19% and 33% carrying rates at normalized scope and isolate capital, storage, loss, obsolescence, and denominator drivers.
- Inventory Carrying Cost Operating Routine: Run a monthly evidence close and quarterly rate review across valuation, cost components, aging, turns, exceptions, approvals, and rollback.
- How to Interpret Inventory Carrying Cost: Read annual amount, monthly equivalent, carrying rate, cost shares, threshold, and status without claiming optimal stock or accounting treatment.
- Inventory Carrying Cost Audit Template: Audit valuation, component lineage, allocations, annualization, arithmetic, accounting boundaries, approvals, monitoring, and restoration.
Use the interactive tool
Enable JavaScript to open the calculator and process browser-local inputs. The explanatory content and source links remain available without JavaScript.
Related guide: Define average inventory value, annual cost components, carrying rate, evidence period, controls, and accounting boundaries.
This tool provides operating estimates, not tax, accounting, legal, financial, or marketplace-policy advice. Verify current official sources and your own records before changing prices or operations.