Inventory carrying cost worked example for fast-moving stock
Last updated: 2026-07-31
Written and reviewed by Seller Profit Guard Editorial Team.
The fast-moving synthetic fixture uses USD 25,000 average inventory, USD 2,000 capital, USD 1,500 storage, USD 250 insurance and inventory tax, USD 300 shrink, USD 450 obsolescence, and USD 250 administration. The total is USD 4,750, the monthly equivalent is USD 395.83, and the rate is 19.00 percent.
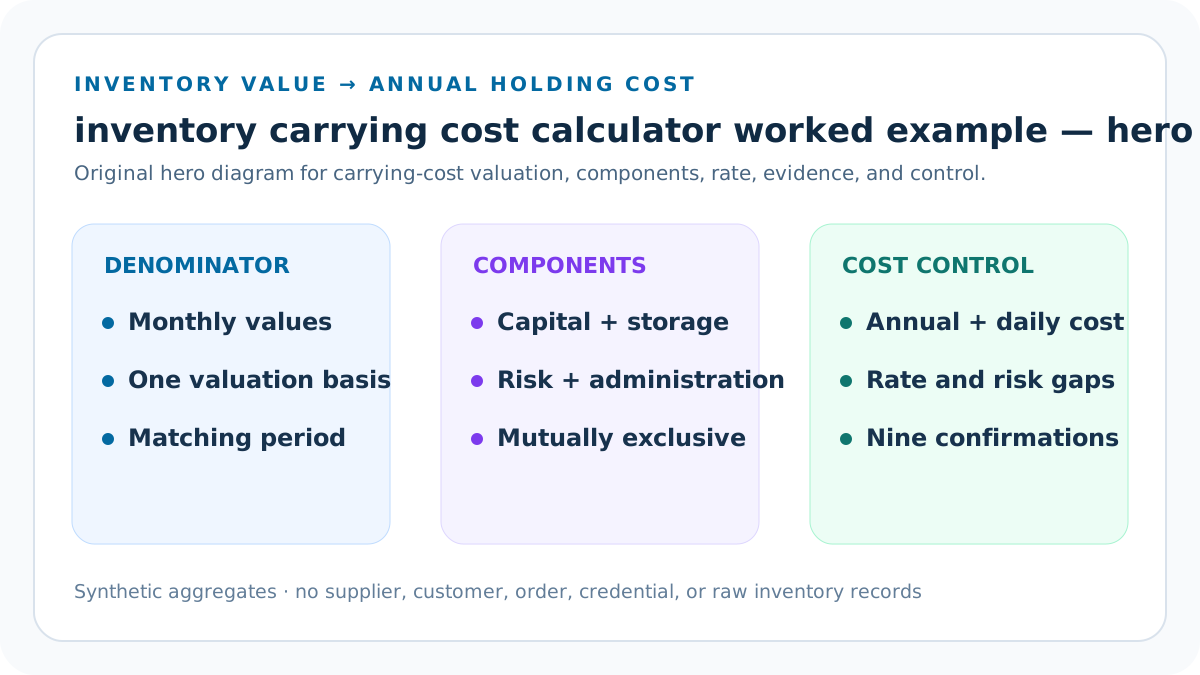
Reconcile the USD 25,000 average
Average the declared monthly values under one cost basis. The fast-moving carrying-cost worksheet records source, valuation, population, period, currency, component, allocation, calculation, timestamp, owner, exception, approval, and prior accepted value needed for a traceable USD 4,750 annual estimate.
One month-end snapshot is insufficient. At review point 1, compare the USD 4,750 and 19 percent fast-moving fixture with the USD 19,800 and 33 percent slow-moving fixture. Identify which difference is arithmetic, which is allocation, and which conclusion still requires operating or accounting evidence.
Verify USD 2,000 capital cost
Tie the annual amount to an approved capital method. The fast-moving carrying-cost worksheet records source, valuation, population, period, currency, component, allocation, calculation, timestamp, owner, exception, approval, and prior accepted value needed for a traceable USD 4,750 annual estimate.
Do not infer it from profit. At review point 2, compare the USD 4,750 and 19 percent fast-moving fixture with the USD 19,800 and 33 percent slow-moving fixture. Identify which difference is arithmetic, which is allocation, and which conclusion still requires operating or accounting evidence.
Verify USD 1,500 storage
Trace allocation to the same inventory population. The fast-moving carrying-cost worksheet records source, valuation, population, period, currency, component, allocation, calculation, timestamp, owner, exception, approval, and prior accepted value needed for a traceable USD 4,750 annual estimate.
Exclude duplicate fulfillment cost. At review point 3, compare the USD 4,750 and 19 percent fast-moving fixture with the USD 19,800 and 33 percent slow-moving fixture. Identify which difference is arithmetic, which is allocation, and which conclusion still requires operating or accounting evidence.
Verify risk costs
Reconcile 250 insurance-tax, 300 shrink, and 450 obsolescence. The fast-moving carrying-cost worksheet records source, valuation, population, period, currency, component, allocation, calculation, timestamp, owner, exception, approval, and prior accepted value needed for a traceable USD 4,750 annual estimate.
Keep source evidence distinct. At review point 4, compare the USD 4,750 and 19 percent fast-moving fixture with the USD 19,800 and 33 percent slow-moving fixture. Identify which difference is arithmetic, which is allocation, and which conclusion still requires operating or accounting evidence.
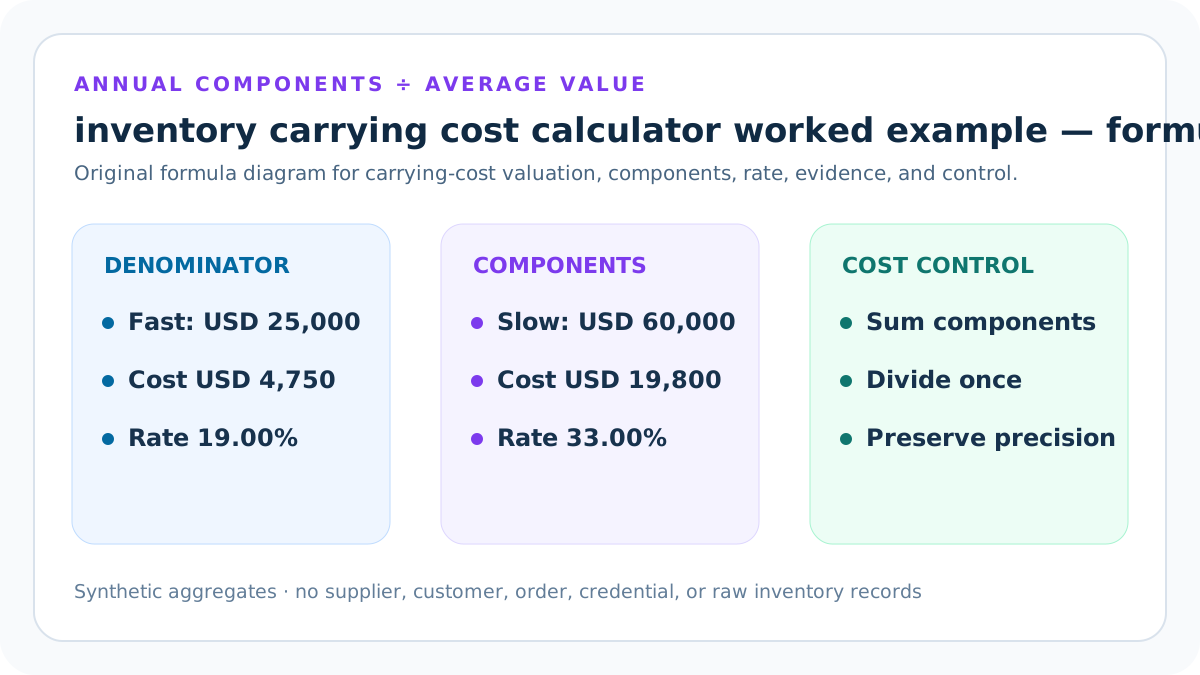
Add USD 250 administration
Tie the carrying-related allocation to inventory control. The fast-moving carrying-cost worksheet records source, valuation, population, period, currency, component, allocation, calculation, timestamp, owner, exception, approval, and prior accepted value needed for a traceable USD 4,750 annual estimate.
General overhead is not automatic. At review point 5, compare the USD 4,750 and 19 percent fast-moving fixture with the USD 19,800 and 33 percent slow-moving fixture. Identify which difference is arithmetic, which is allocation, and which conclusion still requires operating or accounting evidence.
Calculate 19 percent
Divide USD 4,750 by USD 25,000 after all scope checks. The fast-moving carrying-cost worksheet records source, valuation, population, period, currency, component, allocation, calculation, timestamp, owner, exception, approval, and prior accepted value needed for a traceable USD 4,750 annual estimate.
Round only displayed outputs. At review point 6, compare the USD 4,750 and 19 percent fast-moving fixture with the USD 19,800 and 33 percent slow-moving fixture. Identify which difference is arithmetic, which is allocation, and which conclusion still requires operating or accounting evidence.
Interpret the fixture narrowly
Use the result to audit arithmetic and cost mix. The fast-moving carrying-cost worksheet records source, valuation, population, period, currency, component, allocation, calculation, timestamp, owner, exception, approval, and prior accepted value needed for a traceable USD 4,750 annual estimate.
It is not a universal benchmark. At review point 7, compare the USD 4,750 and 19 percent fast-moving fixture with the USD 19,800 and 33 percent slow-moving fixture. Identify which difference is arithmetic, which is allocation, and which conclusion still requires operating or accounting evidence.
Inventory Carrying Cost Worked Example: valuation integrity control
Record one population, consistent inventory cost basis, currency, monthly values, averaging method, and effective mappings. Control 1 defines a pass condition, source owner, independent reviewer, failure owner, correction deadline, sensitivity test, monitoring signal, and restoration trigger before an inventory action can use the result.
Mixed or stale valuation blocks. Apply the control to the concrete fast-moving carrying-cost worksheet; keep average inventory, annual carrying cost, rate, cost shares, inventory valuation, COGS, tax treatment, purchasing, and private source records as separate concepts.
Inventory Carrying Cost Worked Example: component lineage control
Trace capital, storage, insurance, tax, shrink, obsolescence, and administration to distinct evidence and allocation keys. Control 2 defines a pass condition, source owner, independent reviewer, failure owner, correction deadline, sensitivity test, monitoring signal, and restoration trigger before an inventory action can use the result.
Missing or duplicate components block. Apply the control to the concrete fast-moving carrying-cost worksheet; keep average inventory, annual carrying cost, rate, cost shares, inventory valuation, COGS, tax treatment, purchasing, and private source records as separate concepts.
Inventory Carrying Cost Worked Example: period and annualization control
Align cost recognition and average inventory months, disclose scaling, and prefer a complete seasonal cycle. Control 3 defines a pass condition, source owner, independent reviewer, failure owner, correction deadline, sensitivity test, monitoring signal, and restoration trigger before an inventory action can use the result.
Short or mismatched periods require review. Apply the control to the concrete fast-moving carrying-cost worksheet; keep average inventory, annual carrying cost, rate, cost shares, inventory valuation, COGS, tax treatment, purchasing, and private source records as separate concepts.
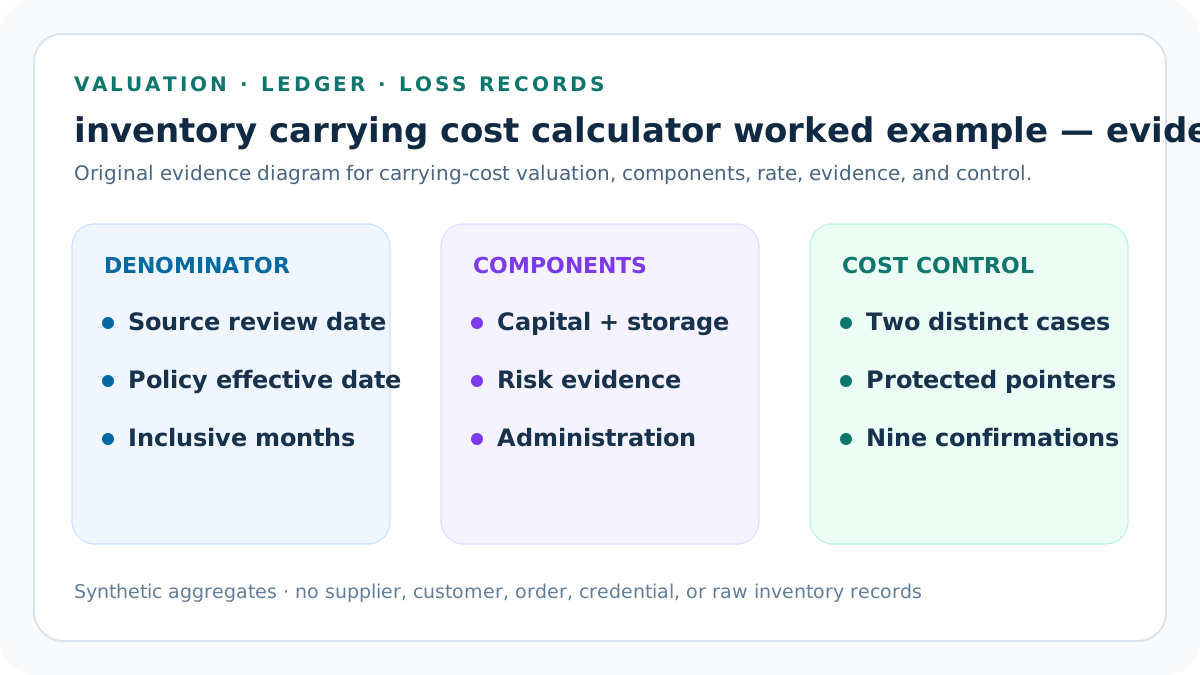
Inventory Carrying Cost Worked Example: seller-threshold control
Record maximum carrying rate, maximum risk-component share, and minimum evidence months under one dated policy. Control 4 defines a pass condition, source owner, independent reviewer, failure owner, correction deadline, sensitivity test, monitoring signal, and restoration trigger before an inventory action can use the result.
A threshold exception returns Review without changing the arithmetic. Apply the control to the concrete fast-moving carrying-cost worksheet; keep average inventory, annual carrying cost, rate, cost shares, inventory valuation, COGS, tax treatment, purchasing, and private source records as separate concepts.
Inventory Carrying Cost Worked Example: confirmation and masking control
Confirm nine valuation, annualization, exclusivity, component-evidence, privacy, and accounting-boundary statements. Control 5 defines a pass condition, source owner, independent reviewer, failure owner, correction deadline, sensitivity test, monitoring signal, and restoration trigger before an inventory action can use the result.
A failed confirmation blocks and masks every derived output. Apply the control to the concrete fast-moving carrying-cost worksheet; keep average inventory, annual carrying cost, rate, cost shares, inventory valuation, COGS, tax treatment, purchasing, and private source records as separate concepts.
Inventory Carrying Cost Worked Example: decision-boundary control
Keep the operating rate separate from COGS, tax capitalization, accounting profit, EOQ, purchasing authority, and optimal-stock claims. Control 6 defines a pass condition, source owner, independent reviewer, failure owner, correction deadline, sensitivity test, monitoring signal, and restoration trigger before an inventory action can use the result.
Arithmetic cannot approve policy. Apply the control to the concrete fast-moving carrying-cost worksheet; keep average inventory, annual carrying cost, rate, cost shares, inventory valuation, COGS, tax treatment, purchasing, and private source records as separate concepts.
Inventory Carrying Cost Worked Example: recovery and privacy control
Keep row-level inventory and expenses private; retain prior values, monitoring, stop rules, and restoration authority. Control 7 defines a pass condition, source owner, independent reviewer, failure owner, correction deadline, sensitivity test, monitoring signal, and restoration trigger before an inventory action can use the result.
Public examples remain synthetic. Apply the control to the concrete fast-moving carrying-cost worksheet; keep average inventory, annual carrying cost, rate, cost shares, inventory valuation, COGS, tax treatment, purchasing, and private source records as separate concepts.
Reconcile the USD 25,000 average: carrying-cost lab 1
Reperform the relevant output from both synthetic fixtures. Average the declared monthly values under one cost basis. Change one component only, preserve the remaining population and valuation assumptions, recalculate annual amount, monthly equivalent, rate, component shares, and expected Block, Review, or Ready status.
One month-end snapshot is insufficient. Test a duplicated warehouse allocation, omitted capital charge, short evidence window, stale write-off, inconsistent recovery, point-in-time denominator, and restored prior model. State the protected evidence and decision approval still required.
Verify USD 2,000 capital cost: carrying-cost lab 2
Reperform the relevant output from both synthetic fixtures. Tie the annual amount to an approved capital method. Change one component only, preserve the remaining population and valuation assumptions, recalculate annual amount, monthly equivalent, rate, component shares, and expected Block, Review, or Ready status.
Do not infer it from profit. Test a duplicated warehouse allocation, omitted capital charge, short evidence window, stale write-off, inconsistent recovery, point-in-time denominator, and restored prior model. State the protected evidence and decision approval still required.
Verify USD 1,500 storage: carrying-cost lab 3
Reperform the relevant output from both synthetic fixtures. Trace allocation to the same inventory population. Change one component only, preserve the remaining population and valuation assumptions, recalculate annual amount, monthly equivalent, rate, component shares, and expected Block, Review, or Ready status.
Exclude duplicate fulfillment cost. Test a duplicated warehouse allocation, omitted capital charge, short evidence window, stale write-off, inconsistent recovery, point-in-time denominator, and restored prior model. State the protected evidence and decision approval still required.
Verify risk costs: carrying-cost lab 4
Reperform the relevant output from both synthetic fixtures. Reconcile 250 insurance-tax, 300 shrink, and 450 obsolescence. Change one component only, preserve the remaining population and valuation assumptions, recalculate annual amount, monthly equivalent, rate, component shares, and expected Block, Review, or Ready status.
Keep source evidence distinct. Test a duplicated warehouse allocation, omitted capital charge, short evidence window, stale write-off, inconsistent recovery, point-in-time denominator, and restored prior model. State the protected evidence and decision approval still required.
Add USD 250 administration: carrying-cost lab 5
Reperform the relevant output from both synthetic fixtures. Tie the carrying-related allocation to inventory control. Change one component only, preserve the remaining population and valuation assumptions, recalculate annual amount, monthly equivalent, rate, component shares, and expected Block, Review, or Ready status.
General overhead is not automatic. Test a duplicated warehouse allocation, omitted capital charge, short evidence window, stale write-off, inconsistent recovery, point-in-time denominator, and restored prior model. State the protected evidence and decision approval still required.
Calculate 19 percent: carrying-cost lab 6
Reperform the relevant output from both synthetic fixtures. Divide USD 4,750 by USD 25,000 after all scope checks. Change one component only, preserve the remaining population and valuation assumptions, recalculate annual amount, monthly equivalent, rate, component shares, and expected Block, Review, or Ready status.
Round only displayed outputs. Test a duplicated warehouse allocation, omitted capital charge, short evidence window, stale write-off, inconsistent recovery, point-in-time denominator, and restored prior model. State the protected evidence and decision approval still required.
Interpret the fixture narrowly: carrying-cost lab 7
Reperform the relevant output from both synthetic fixtures. Use the result to audit arithmetic and cost mix. Change one component only, preserve the remaining population and valuation assumptions, recalculate annual amount, monthly equivalent, rate, component shares, and expected Block, Review, or Ready status.
It is not a universal benchmark. Test a duplicated warehouse allocation, omitted capital charge, short evidence window, stale write-off, inconsistent recovery, point-in-time denominator, and restored prior model. State the protected evidence and decision approval still required.
Inventory Carrying Cost Worked Example: intent-specific implementation walkthrough
fast-moving carrying-cost worksheet checkpoint 1 addresses reconcile the usd 25,000 average as a distinct requirement for a traceable USD 4,750 annual estimate. Average the declared monthly values under one cost basis. Record the resulting source decision, formula effect, reviewer question, failed alternative, correction owner, and restoration value in language specific to this checkpoint. One month-end snapshot is insufficient.
fast-moving carrying-cost worksheet checkpoint 2 addresses verify usd 2,000 capital cost as a distinct requirement for a traceable USD 4,750 annual estimate. Tie the annual amount to an approved capital method. Record the resulting source decision, formula effect, reviewer question, failed alternative, correction owner, and restoration value in language specific to this checkpoint. Do not infer it from profit.
fast-moving carrying-cost worksheet checkpoint 3 addresses verify usd 1,500 storage as a distinct requirement for a traceable USD 4,750 annual estimate. Trace allocation to the same inventory population. Record the resulting source decision, formula effect, reviewer question, failed alternative, correction owner, and restoration value in language specific to this checkpoint. Exclude duplicate fulfillment cost.
fast-moving carrying-cost worksheet checkpoint 4 addresses verify risk costs as a distinct requirement for a traceable USD 4,750 annual estimate. Reconcile 250 insurance-tax, 300 shrink, and 450 obsolescence. Record the resulting source decision, formula effect, reviewer question, failed alternative, correction owner, and restoration value in language specific to this checkpoint. Keep source evidence distinct.
fast-moving carrying-cost worksheet checkpoint 5 addresses add usd 250 administration as a distinct requirement for a traceable USD 4,750 annual estimate. Tie the carrying-related allocation to inventory control. Record the resulting source decision, formula effect, reviewer question, failed alternative, correction owner, and restoration value in language specific to this checkpoint. General overhead is not automatic.
fast-moving carrying-cost worksheet checkpoint 6 addresses calculate 19 percent as a distinct requirement for a traceable USD 4,750 annual estimate. Divide USD 4,750 by USD 25,000 after all scope checks. Record the resulting source decision, formula effect, reviewer question, failed alternative, correction owner, and restoration value in language specific to this checkpoint. Round only displayed outputs.
fast-moving carrying-cost worksheet checkpoint 7 addresses interpret the fixture narrowly as a distinct requirement for a traceable USD 4,750 annual estimate. Use the result to audit arithmetic and cost mix. Record the resulting source decision, formula effect, reviewer question, failed alternative, correction owner, and restoration value in language specific to this checkpoint. It is not a universal benchmark.
Evidence boundary for a traceable USD 4,750 annual estimate
The packet can demonstrate entered average inventory value, capital, storage, insurance and inventory tax, shrink, obsolescence, administration, annual sum, monthly and daily equivalents, carrying rate, percentage-point gap, component shares, three seller thresholds, nine confirmations, and sensitivity. Annual carrying cost equals capital plus storage plus insurance and inventory tax plus shrink and inventory loss plus obsolescence plus carrying-related administration. Annual carrying rate equals that total divided by average inventory value on the same valuation, population, currency, and period basis.
It cannot prove financial-statement inventory value, tax capitalization, COGS, accounting profit, cash timing, optimal inventory, demand, supplier performance, service level, stockout prevention, economic order quantity, or the correct business action.
Release, monitor, and restore the fast-moving carrying-cost worksheet
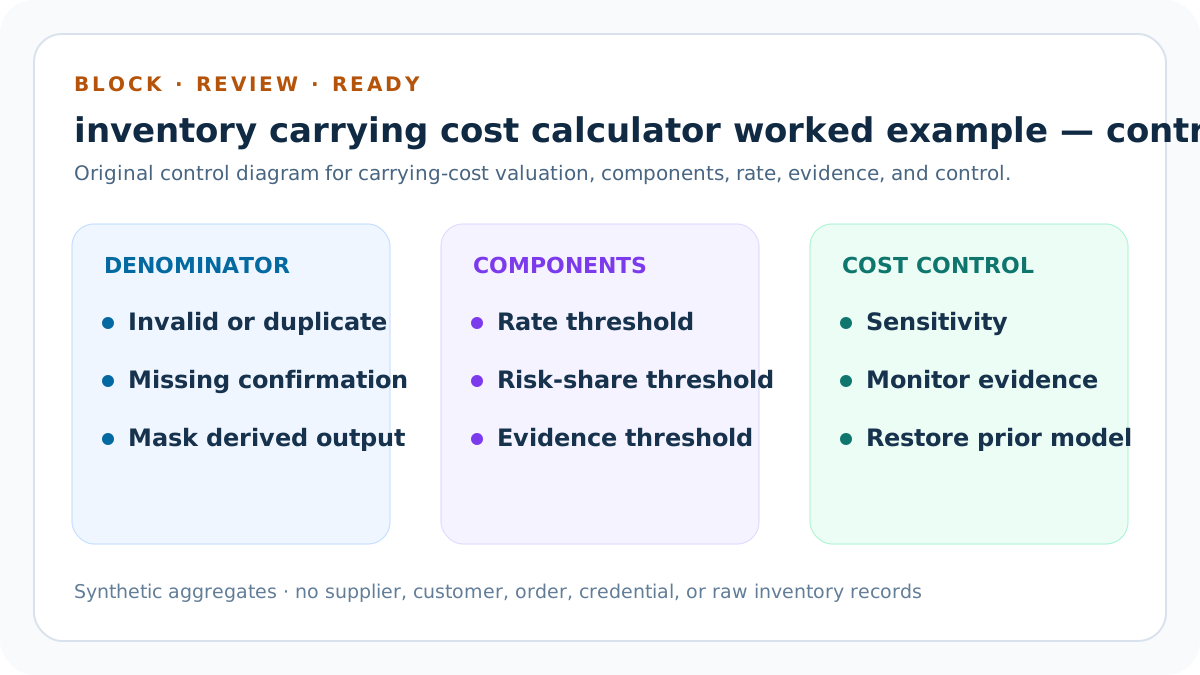
Block invalid dates, population, valuation, non-finite amounts, currency, period reconciliation, duplicate scenarios, thresholds, confirmations, privacy, or open conflicts and mask all derived outputs. Review evidence below the seller minimum, rates or risk shares above their thresholds, and annual costs above average inventory value. Ready clears only the entered operating worksheet.
Before indexing or operational use, preserve evidence and rollback artifacts, run typecheck, unit, integration, build, content, similarity, SEO, image, link, mobile, strict-route, deployment, and live checks, then compare later evidence without claiming same-period causality.
Inventory Carrying Cost Worked Example: concrete working record
The fast-moving synthetic fixture uses USD 25,000 average inventory, USD 2,000 capital, USD 1,500 storage, USD 250 insurance and inventory tax, USD 300 shrink, USD 450 obsolescence, and USD 250 administration. The total is USD 4,750, the monthly equivalent is USD 395.83, and the rate is 19.00 percent. Reperform 2,000 + 1,500 + 250 + 300 + 450 + 250 = 4,750. Divide 4,750 by 25,000 to obtain 0.19, or 19.00 percent. Divide 4,750 by twelve to obtain USD 395.83 per month. Capital is 42.11 percent of carrying cost, storage is 31.58 percent, and insurance-tax plus shrink plus obsolescence is 21.05 percent. Keep the administration remainder visible.
Sources and further reading
- Seller Profit Guard methodology: Evidence, formula, privacy, correction, release, monitoring, and rollback rules.
- Seller Profit Guard data privacy: Local-first boundaries for inventory, expense, supplier, customer, order, and raw export data.
- NetSuite Help: Inventory Turnover Report: Official month-end average inventory value, turnover, and days-on-hand calculations.
- Oracle Inventory Optimization User's Guide: Official statement that average inventory level is often used to calculate inventory carrying cost.
- NetSuite Help: Setting Inventory Costing Preferences: Official inventory-costing preference and negative-inventory treatment boundary.
- NetSuite Help: Inventory Items: Official separation of inventory quantity and value, COGS, income, and location records.
- IRS Publication 538: Accounting Periods and Methods: Official tax inventory valuation and accounting-method boundary.
- IRS Publication 583: Starting a Business and Keeping Records: Official inventory-cost and business-expense recordkeeping guidance.
- GAO: Defense Inventory—Applying Commercial Purchasing Practices: Primary source defining investment, storage, obsolescence, and inventory-loss components and the average on-hand inventory denominator.
- GAO: Greater Use of Commercial Distribution Systems: Primary source describing annual inventory holding costs and obsolescence exposure.
- Oracle E-Business Suite: Materials Management: Official source on tied-up cash, carrying cost, write-offs, degradation, and obsolescence.
- Microsoft Learn: Managing inventory costs: Official boundary for inventory valuation, cost methods, ledger posting, and COGS.
- IRS Publication 551: Basis of Assets: Official boundary for tax capitalization and inventory-cost treatment.
- IRS Publication 334: Tax Guide for Small Business: Official distinction among ending inventory, COGS, manufacturing overhead, and other expenses.
Related Seller Profit Guard tools
- Inventory Carrying Cost Calculator: Calculate annual carrying amount, monthly equivalent, cost mix, rate, and review status.
- Safety Stock Calculator: Estimate a statistical buffer before reviewing its holding consequences.
- Reorder Point Calculator: Review replenishment timing separately from annual holding cost.
- Overhead Allocation Calculator: Allocate recurring business overhead without automatically classifying every line as carrying cost.
- Contribution Margin Calculator: Measure order contribution separately from inventory investment.
- Methodology: Review evidence, formula, privacy, correction, release, and rollback.
- Data Privacy: Protect inventory, expense, supplier, customer, and raw export data.
- Inventory Carrying Cost Formula and Inputs: Define average inventory value, annual capital, storage, insurance, shrink, obsolescence, administration, carrying rate, and evidence rules.
- Inventory Carrying Cost for Slow-Moving Stock: Calculate USD 19,800 annual carrying cost and a 33% rate for slow-moving inventory with higher storage, loss, and obsolescence exposure.
- Inventory Carrying Cost Mistakes: Correct ending-balance denominators, period mismatch, duplicate costs, hidden loss netting, unsupported capital rates, and accounting confusion.
- Inventory Carrying Cost Data Sources: Map average inventory values, capital assumptions, warehouse costs, insurance, losses, write-offs, and administration to authoritative evidence.
- Inventory Carrying Cost Decision Gates: Separate arithmetic readiness from valuation, allocation, threshold, service, cash, accounting, approval, monitoring, and rollback gates.
- Fast vs Slow Inventory Carrying Cost: Compare 19% and 33% carrying rates at normalized scope and isolate capital, storage, loss, obsolescence, and denominator drivers.
- Inventory Carrying Cost Operating Routine: Run a monthly evidence close and quarterly rate review across valuation, cost components, aging, turns, exceptions, approvals, and rollback.
- How to Interpret Inventory Carrying Cost: Read annual amount, monthly equivalent, carrying rate, cost shares, threshold, and status without claiming optimal stock or accounting treatment.
- Inventory Carrying Cost Audit Template: Audit valuation, component lineage, allocations, annualization, arithmetic, accounting boundaries, approvals, monitoring, and restoration.
Next step: Open Seller Profit Guard.
This is operational planning help, not tax, accounting, legal, financial, or platform-policy advice. Review the Terms and disclaimer, and verify current platform rules and fee assumptions before changing prices.