One-off versus batch handmade labor cost
Last updated: 2026-07-31
Written and reviewed by Seller Profit Guard Editorial Team.
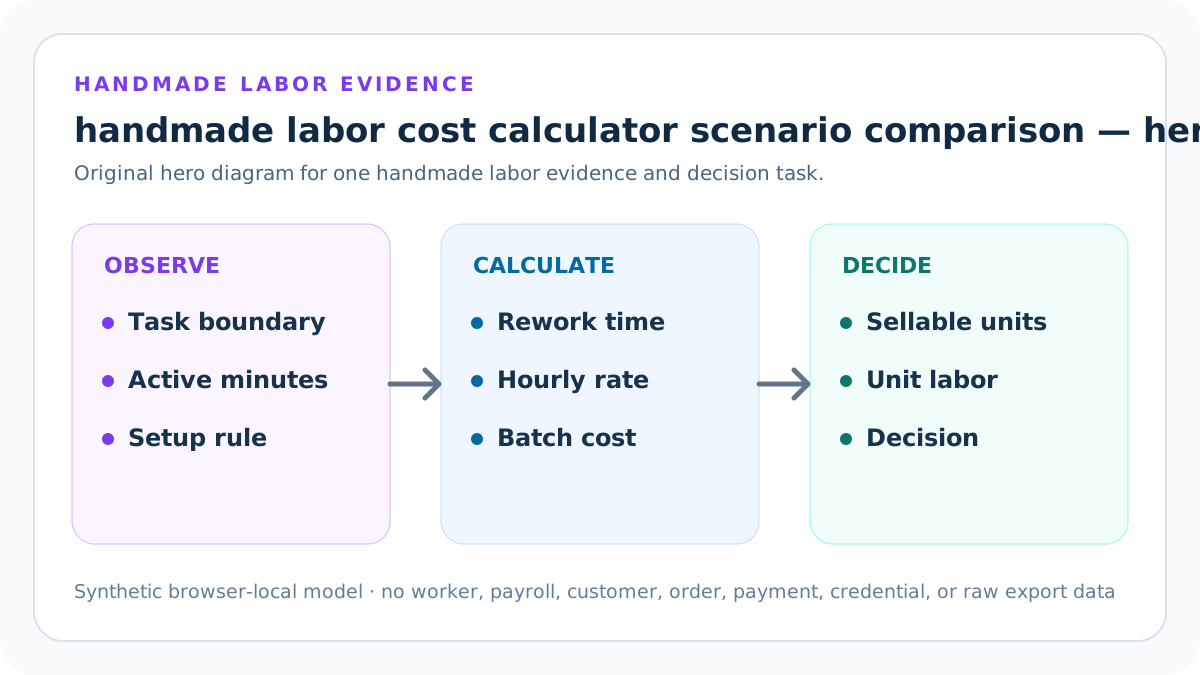
The one-off packet uses 45 active minutes, 20 setup minutes, 10% rework, and one sellable unit to produce USD 27.80 at USD 24 per hour. The batch uses 18 minutes per unit, 30 setup minutes, 8% rework, and twelve sellable units to produce USD 8.78 each. Attribute every difference before claiming scale.
Hold product identity constant
Confirm material, dimensions, finish, tool, quality, and packaging remain comparable. Put comparison row 1 in a same-grain matrix with one-off and batch values, units, source versions, held-constant terms, and the isolated replacement. Do not compare total batch values with per-unit values or different quality standards.
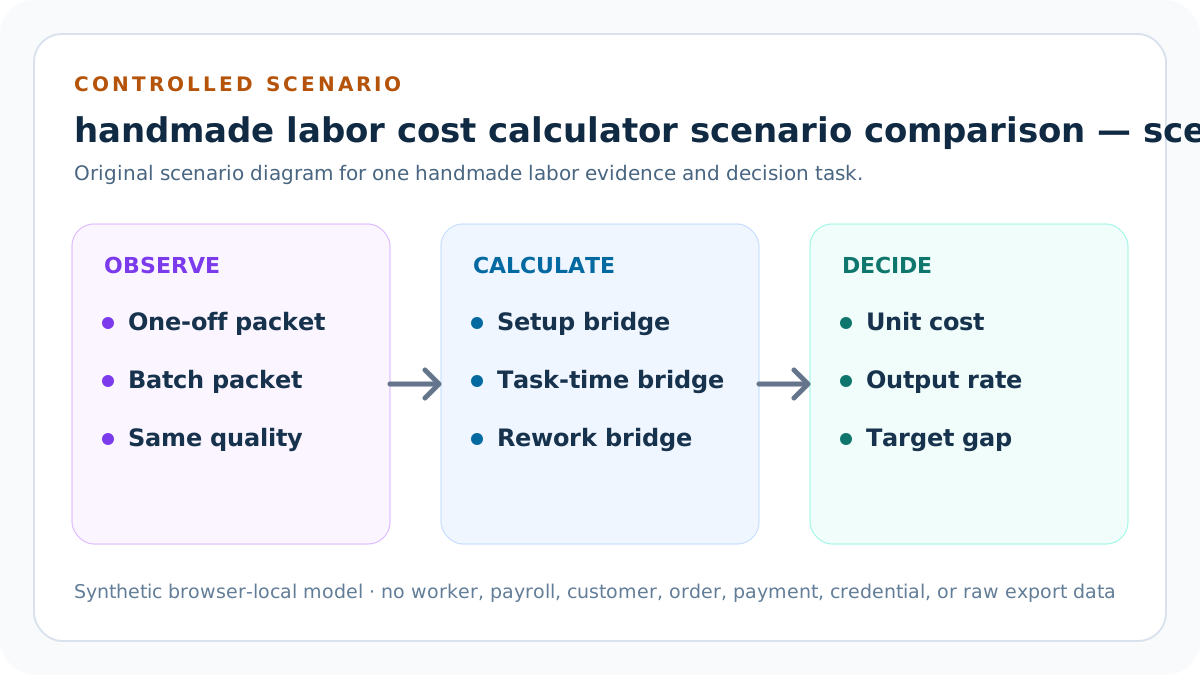
Build a bridge that applies this row after the previous state and before the next change. The bridge must reconcile minutes, component cost, unit allocation, output rate, and target gap so an attributable explanation of unit labor movement has an attributable driver.
Compare active task time
Read 45 versus 18 minutes while showing workflow and observation differences. Put comparison row 2 in a same-grain matrix with one-off and batch values, units, source versions, held-constant terms, and the isolated replacement. Do not compare total batch values with per-unit values or different quality standards.
Build a bridge that applies this row after the previous state and before the next change. The bridge must reconcile minutes, component cost, unit allocation, output rate, and target gap so an attributable explanation of unit labor movement has an attributable driver.
Compare setup
Read 20 versus 30 total minutes, then allocate across one versus twelve sellable units. Put comparison row 3 in a same-grain matrix with one-off and batch values, units, source versions, held-constant terms, and the isolated replacement. Do not compare total batch values with per-unit values or different quality standards.
Build a bridge that applies this row after the previous state and before the next change. The bridge must reconcile minutes, component cost, unit allocation, output rate, and target gap so an attributable explanation of unit labor movement has an attributable driver.
Compare rework
Read 10% versus 8% only when correction evidence supports each rate. Put comparison row 4 in a same-grain matrix with one-off and batch values, units, source versions, held-constant terms, and the isolated replacement. Do not compare total batch values with per-unit values or different quality standards.
Build a bridge that applies this row after the previous state and before the next change. The bridge must reconcile minutes, component cost, unit allocation, output rate, and target gap so an attributable explanation of unit labor movement has an attributable driver.
Hold hourly rate constant
Use USD 24 to avoid attributing a costing-policy change to production scale. Put comparison row 5 in a same-grain matrix with one-off and batch values, units, source versions, held-constant terms, and the isolated replacement. Do not compare total batch values with per-unit values or different quality standards.
Build a bridge that applies this row after the previous state and before the next change. The bridge must reconcile minutes, component cost, unit allocation, output rate, and target gap so an attributable explanation of unit labor movement has an attributable driver.
Compare total minutes
Read 69.5 versus 263.28 batch minutes without confusing total and per-unit work. Put comparison row 6 in a same-grain matrix with one-off and batch values, units, source versions, held-constant terms, and the isolated replacement. Do not compare total batch values with per-unit values or different quality standards.
Build a bridge that applies this row after the previous state and before the next change. The bridge must reconcile minutes, component cost, unit allocation, output rate, and target gap so an attributable explanation of unit labor movement has an attributable driver.
Compare batch cost
Read USD 27.80 versus USD 105.312 at full precision. Put comparison row 7 in a same-grain matrix with one-off and batch values, units, source versions, held-constant terms, and the isolated replacement. Do not compare total batch values with per-unit values or different quality standards.
Build a bridge that applies this row after the previous state and before the next change. The bridge must reconcile minutes, component cost, unit allocation, output rate, and target gap so an attributable explanation of unit labor movement has an attributable driver.
Compare unit cost
Read USD 27.80 versus USD 8.776 with sellable denominators visible. Put comparison row 8 in a same-grain matrix with one-off and batch values, units, source versions, held-constant terms, and the isolated replacement. Do not compare total batch values with per-unit values or different quality standards.
Build a bridge that applies this row after the previous state and before the next change. The bridge must reconcile minutes, component cost, unit allocation, output rate, and target gap so an attributable explanation of unit labor movement has an attributable driver.
Compare setup allocation
Read USD 8 versus USD 1 per sellable unit. Put comparison row 9 in a same-grain matrix with one-off and batch values, units, source versions, held-constant terms, and the isolated replacement. Do not compare total batch values with per-unit values or different quality standards.
Build a bridge that applies this row after the previous state and before the next change. The bridge must reconcile minutes, component cost, unit allocation, output rate, and target gap so an attributable explanation of unit labor movement has an attributable driver.
Compare effective output
Read 0.86 versus 2.73 sellable units per labor hour. Put comparison row 10 in a same-grain matrix with one-off and batch values, units, source versions, held-constant terms, and the isolated replacement. Do not compare total batch values with per-unit values or different quality standards.
Build a bridge that applies this row after the previous state and before the next change. The bridge must reconcile minutes, component cost, unit allocation, output rate, and target gap so an attributable explanation of unit labor movement has an attributable driver.
Compare targets
Use USD 30 and USD 10 as separate seller policies, not evidence of market value. Put comparison row 11 in a same-grain matrix with one-off and batch values, units, source versions, held-constant terms, and the isolated replacement. Do not compare total batch values with per-unit values or different quality standards.
Build a bridge that applies this row after the previous state and before the next change. The bridge must reconcile minutes, component cost, unit allocation, output rate, and target gap so an attributable explanation of unit labor movement has an attributable driver.
Attribute before deciding
Build a bridge from task design, setup allocation, rework, rate, quality, and denominator. Put comparison row 12 in a same-grain matrix with one-off and batch values, units, source versions, held-constant terms, and the isolated replacement. Do not compare total batch values with per-unit values or different quality standards.
Build a bridge that applies this row after the previous state and before the next change. The bridge must reconcile minutes, component cost, unit allocation, output rate, and target gap so an attributable explanation of unit labor movement has an attributable driver.
Use the calculator with a controlled packet
Open the parent tool only after the one-off and batch labor comparison matrix has one task, product, quality standard, start-stop rule, sellable-unit definition, rate purpose, currency, and evidence month. Enter aggregate values; do not paste worker identity, payroll, schedules, customer data, order rows, private product files, credentials, or raw exports.
Save full-precision inputs and outputs beside the visible rounded result. Run the default one-off fixture, the twelve-unit batch fixture, the below-target Review, seller-threshold boundary cases, and invalid finite-number, date, confirmation, and structural Block cases. A changed value is accepted only when its source, owner, scope, effective date, and replacement trigger are recorded.
Apply non-compensating quality gates
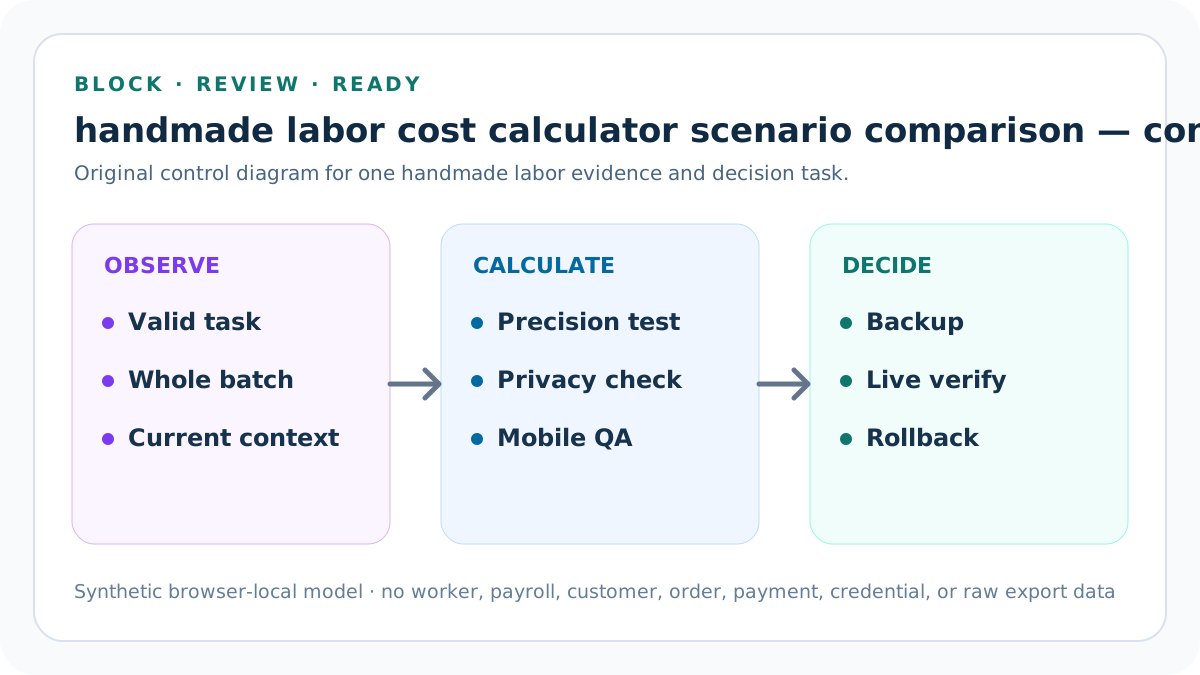
Block blank, nonfinite, negative, or invalid task time, batch structure, rate, target, rework range, seller thresholds, source date, confirmations, currency, period, scope, or declared conflict before interpreting cost. After structure passes, Review labor above target, rework above its seller maximum, setup share above its seller maximum, stale evidence, quality drift, or a scenario whose product and process boundaries no longer match.
Ready means the current inputs produce an attributable explanation of unit labor movement under one declared model. It does not determine a lawful wage, payroll treatment, worker classification, tax, safety, market price, accounting profit, capacity, customer demand, revenue, or income.
Document uncertainty and sensitivity
Change one assumption at a time: active task minutes, setup, attempted units, sellable units, rework, hourly rate, or target. Keep low, expected, and high scenarios when observations vary materially. Do not hide known conflict in a larger rework allowance or choose only the fastest run.
For scenario 7, record the full before state, the isolated change, the recalculated component costs, unit result, target headroom, decision, quality outcome, owner, and follow-up. Sensitivity explains what drives the result; it does not prove that the chosen change is safe or commercially desirable.
Keep public evidence private and non-identifying
Public examples are synthetic. Keep worker names, employee identifiers, schedules, medical or performance records, payroll, buyer names, addresses, emails, order IDs, messages, payment data, customer files, proprietary designs, supplier-confidential documents, credentials, and raw exports outside the one-off and batch labor comparison matrix.
Use non-identifying task aliases, aggregates, ranges, and protected source pointers. A reviewer should be able to reproduce the calculation contract without receiving personal, customer, payment, or confidential production data.
Release, monitor, correct, and roll back
Before public release, preserve narrow local and remote backups and a rollback identifier. Run syntax, typecheck, focused and full unit tests, integration, build, SEO and duplicate audits, mobile and keyboard QA, static-route validation, image and link checks, candidate-origin review, and live calculator scenarios.
After release, verify status, canonical, indexability, schema, answer blocks, images, hub discovery, strict 404, sitemap membership, and production behavior. Record Day 0/7/14/28 evidence without claiming same-day causality. Restore the prior verified state if formula, content, accessibility, analytics, routing, privacy, or live health regresses.
Constant-time bridge
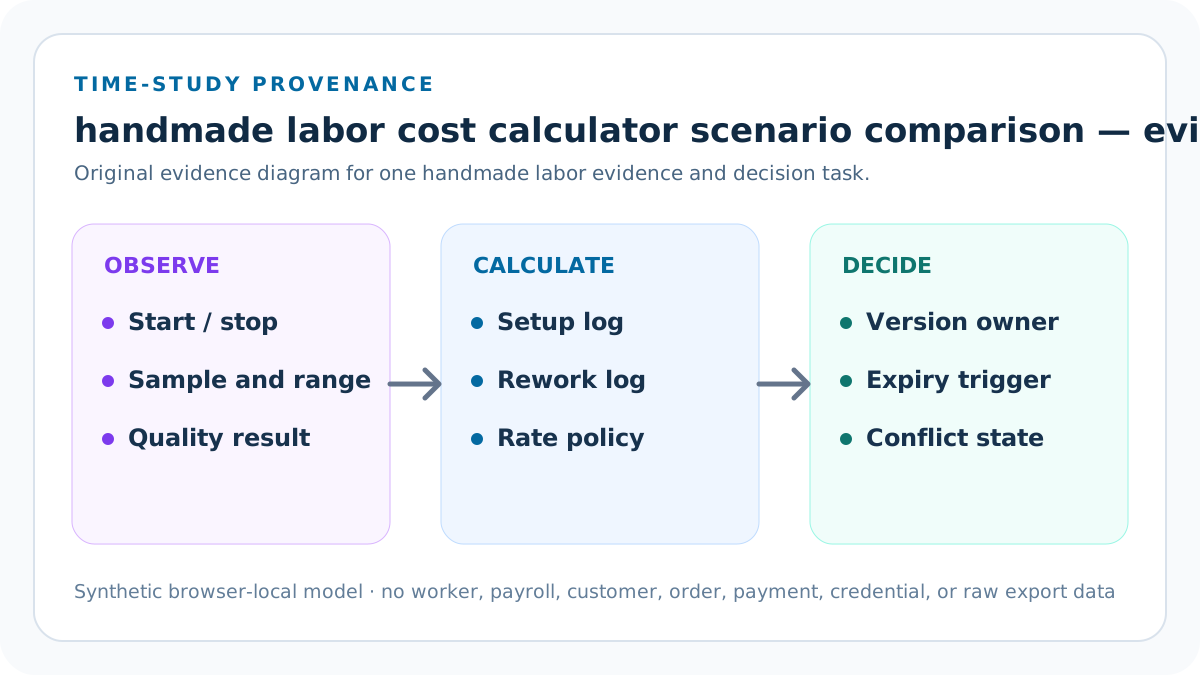
Hold repeated task minutes constant to isolate setup allocation alone. Store the task packet, relevant aggregate observation, unrounded calculation, displayed value, decision, owner, review date, expiry condition, and correction route. Deep check 1 is incomplete when a reviewer must guess the timer rule, sellable denominator, quality standard, rate purpose, or source version.
An independent review should reproduce why this check supports an attributable explanation of unit labor movement and identify the closest counterexample. Preserve competing evidence as a named scenario instead of averaging it away, and keep wage, payroll, employment, tax, safety, price, profit, capacity, demand, revenue, and income claims outside the result.
Setup bridge
Then change setup and show its batch and per-unit effect. Store the task packet, relevant aggregate observation, unrounded calculation, displayed value, decision, owner, review date, expiry condition, and correction route. Deep check 2 is incomplete when a reviewer must guess the timer rule, sellable denominator, quality standard, rate purpose, or source version.
An independent review should reproduce why this check supports an attributable explanation of unit labor movement and identify the closest counterexample. Preserve competing evidence as a named scenario instead of averaging it away, and keep wage, payroll, employment, tax, safety, price, profit, capacity, demand, revenue, and income claims outside the result.
Task-design bridge
Replace active minutes only after documenting workflow differences. Store the task packet, relevant aggregate observation, unrounded calculation, displayed value, decision, owner, review date, expiry condition, and correction route. Deep check 3 is incomplete when a reviewer must guess the timer rule, sellable denominator, quality standard, rate purpose, or source version.
An independent review should reproduce why this check supports an attributable explanation of unit labor movement and identify the closest counterexample. Preserve competing evidence as a named scenario instead of averaging it away, and keep wage, payroll, employment, tax, safety, price, profit, capacity, demand, revenue, and income claims outside the result.
Rework bridge
Change correction allowance only after quality and defect evidence aligns. Store the task packet, relevant aggregate observation, unrounded calculation, displayed value, decision, owner, review date, expiry condition, and correction route. Deep check 4 is incomplete when a reviewer must guess the timer rule, sellable denominator, quality standard, rate purpose, or source version.
An independent review should reproduce why this check supports an attributable explanation of unit labor movement and identify the closest counterexample. Preserve competing evidence as a named scenario instead of averaging it away, and keep wage, payroll, employment, tax, safety, price, profit, capacity, demand, revenue, and income claims outside the result.
Denominator bridge
Reconcile attempted, completed, rejected, reworked, and sellable output. Store the task packet, relevant aggregate observation, unrounded calculation, displayed value, decision, owner, review date, expiry condition, and correction route. Deep check 5 is incomplete when a reviewer must guess the timer rule, sellable denominator, quality standard, rate purpose, or source version.
An independent review should reproduce why this check supports an attributable explanation of unit labor movement and identify the closest counterexample. Preserve competing evidence as a named scenario instead of averaging it away, and keep wage, payroll, employment, tax, safety, price, profit, capacity, demand, revenue, and income claims outside the result.
Scale-claim limit
Do not infer future capacity, worker performance, price, demand, profit, or income. Store the task packet, relevant aggregate observation, unrounded calculation, displayed value, decision, owner, review date, expiry condition, and correction route. Deep check 6 is incomplete when a reviewer must guess the timer rule, sellable denominator, quality standard, rate purpose, or source version.
An independent review should reproduce why this check supports an attributable explanation of unit labor movement and identify the closest counterexample. Preserve competing evidence as a named scenario instead of averaging it away, and keep wage, payroll, employment, tax, safety, price, profit, capacity, demand, revenue, and income claims outside the result.
Sources and further reading
- Seller Profit Guard methodology: Comparable-grain evidence, deterministic calculations, validation, correction, release, and rollback.
- Seller Profit Guard data privacy: Local-first boundaries for worker, seller, customer, order, payment, contact, credential, and raw export data.
- U.S. Department of Labor: Hours Worked: Primary U.S. context for compensable-time questions; the calculator does not determine lawful hours or wages.
- IRS Publication 334 (2025): Primary U.S. context distinguishing manufacturing labor allocable to finished saleable product from other labor; the calculator does not determine tax or accounting treatment.
- IRS Schedule C instructions (2025): Primary U.S. record and cost-of-goods context, including the instruction not to deduct the value of an owner's own labor; the calculator does not determine tax or accounting treatment.
- U.S. Bureau of Labor Statistics: May 2025 Occupational Employment and Wages: Current primary U.S. occupational wage-estimate context; an OEWS estimate is not a seller-specific all-in cost rate, payroll calculation, or lawful wage.
Related Seller Profit Guard tools
- Open the Handmade Labor Cost Calculator: Convert setup, active task time, batch size, rework, and hourly rate into labor cost per sellable unit.
- Listing Cost Library: Version labor and other unit-cost evidence without exposing private records.
- Product Price Floor Calculator: Use labor as one cost input in a seller-owned price boundary.
- Contribution Margin Calculator: Review contribution for one observed order after labor and other variable costs.
- Custom Order Quote Calculator: Model customer-specific design, revision, rush, fulfillment, and quote decisions separately.
- Methodology: Review evidence, privacy, formulas, tests, release, correction, and rollback.
- Handmade Labor Cost Formula and Inputs: Continue with a distinct handmade labor formula, example, source, threshold, comparison, operating, interpretation, or audit task.
- One-Off Handmade Labor Cost Example: Continue with a distinct handmade labor formula, example, source, threshold, comparison, operating, interpretation, or audit task.
- Batch Handmade Labor Cost Scenario: Continue with a distinct handmade labor formula, example, source, threshold, comparison, operating, interpretation, or audit task.
- Handmade Labor Cost Calculation Mistakes: Continue with a distinct handmade labor formula, example, source, threshold, comparison, operating, interpretation, or audit task.
- Reliable Handmade Labor Cost Data: Continue with a distinct handmade labor formula, example, source, threshold, comparison, operating, interpretation, or audit task.
Next step: Open the Handmade Labor Cost Calculator.
This is operational planning help, not tax, accounting, legal, financial, or platform-policy advice. Review the Terms and disclaimer, and verify current platform rules and fee assumptions before changing prices.