Etsy Ads break-even comparison: low-cost versus high-return
Last updated: 2026-07-29
Written and reviewed by Seller Profit Guard Editorial Team.
Compare Etsy Ads scenarios at the same revenue, fee market, currency, target margin, and attribution grain. Hold those variables constant, then change product, fulfillment, or expected return loss one layer at a time. The resulting difference in target-safe spend, ACOS, and ROAS identifies which listing economics—not dashboard revenue alone—drive the decision.

How do you make two Etsy Ads scenarios comparable?
Align item plus shipping revenue, currency, fee market, fixed fee, target margin, reporting dates, Ads attribution treatment, and cost-accounting method. If the listings have different prices, normalize dollars per converted order and compare percentage outputs cautiously.
Use the same definition of expected return loss. One scenario cannot use refund value while the other uses unrecovered operating loss. Use mature cohorts and declare when a fallback assumption is broader than the advertised listing.
Preserve the advertised-listing set and product mix. A shop-level ROAS comparison is not controlled if one period shifts from low-cost digital items to high-labor physical products. The calculation should explain the mix rather than hide it.
| Control | Scenario A | Scenario B |
|---|---|---|
| Revenue | $40 | $40 |
| Fee assumption | 9.5% + $0.30 | 9.5% + $0.30 |
| Target | 20% | 20% |
| Base direct cost | $16 | $20 |
| Expected return loss | $0.80 | $4.00 |
| Changed family | Low severity | High severity |
What does the aligned $40 comparison calculate?
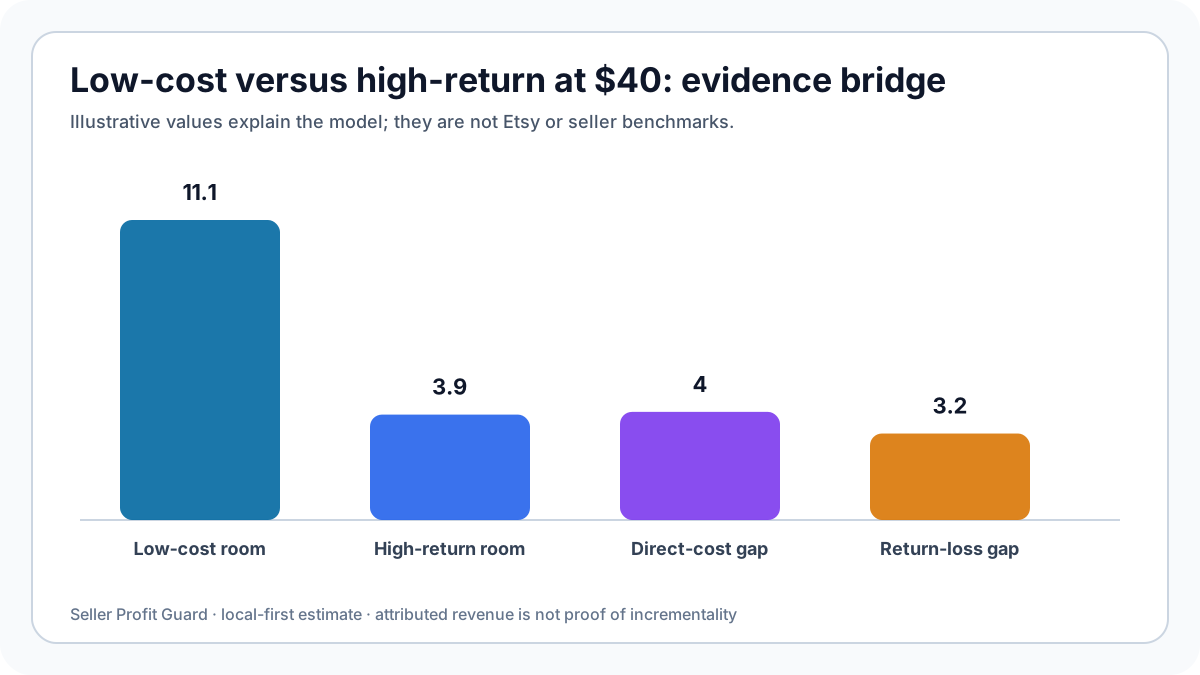
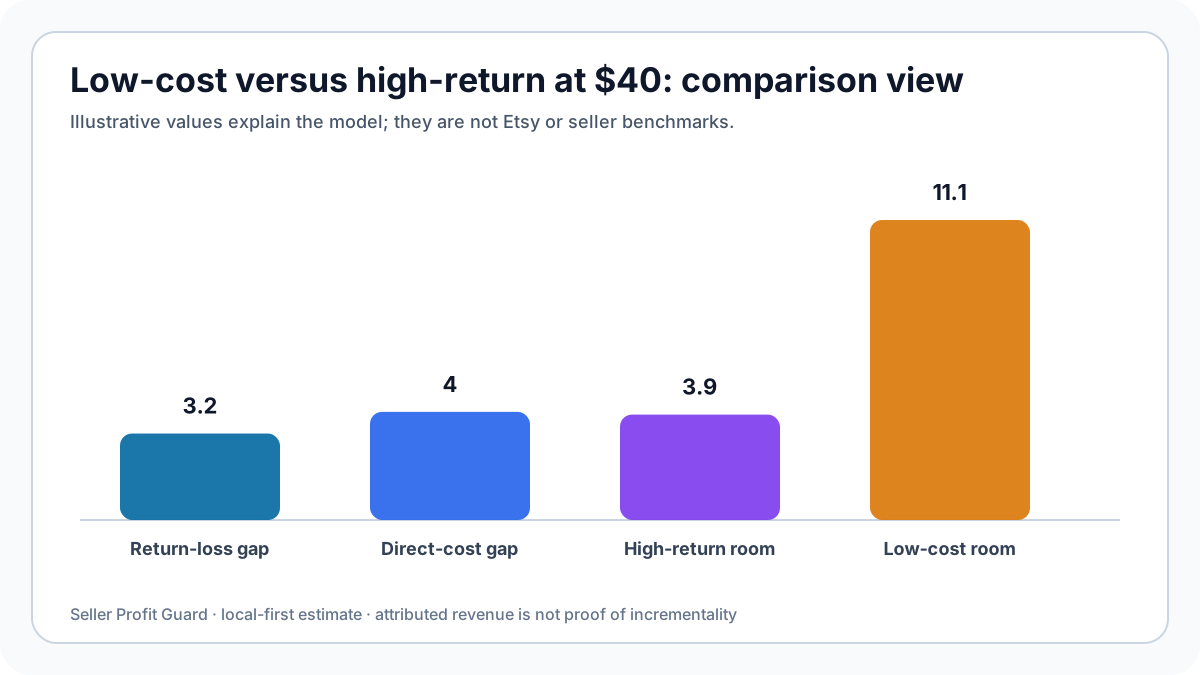
Scenario A uses $40 revenue, $16 combined product, package, labor, and shipping cost, $4.10 percentage and fixed fees, $0.80 expected return loss, and zero Offsite Ads. Contribution before Etsy Ads is $19.10. With an $8 target, target-safe spend is $11.10.
Scenario B keeps revenue, fees, target, and Offsite Ads unchanged but uses $20 direct cost and $4 expected return loss. Contribution before ads is $11.90 and target-safe spend is $3.90. The $7.20 difference equals the $4 direct-cost increase plus $3.20 extra expected return loss.
Scenario A target ACOS is 27.75% and target ROAS about 3.60x. Scenario B target ACOS is 9.75% and target ROAS about 10.26x. The same dashboard ROAS can be comfortable for A and unsafe for B.

How do you decompose the difference without guessing?
Start from Scenario A and replace one input family at a time: first direct cost, then expected return loss. Recalculate target-safe spend after each replacement. This bridge attributes $4 of lost room to direct cost and $3.20 to return severity.
If revenue, fee, or target also differs, add separate bridge steps. Do not attribute the entire gap to returns because the scenario is labeled high-return. The arithmetic, not the name, identifies the driver.
Store the bridge table in the decision record. A future change in shipping or fee base can then be added without rewriting history. Exact decomposition helps choose a lever rather than making a generic 'improve ROAS' recommendation.
Which listing should receive the next bounded ad test?
If both have similar demand evidence, Scenario A supports more target-safe spend and a wider uncertainty buffer. That does not prove it will convert better. It means its order economics tolerate more acquisition cost under the declared inputs.
Scenario B may still be advertised at a lower ceiling or after reducing return severity, direct cost, or target mismatch. Do not starve it solely because its current dashboard ROAS is lower; first separate traffic quality from product economics.
Define an allocation rule before changing budgets. For example, require each listing's mature observed spend per attributed order to remain under its own target-safe ceiling. Avoid one shop-wide ceiling that transfers hidden losses.
How should the comparison be monitored after release?
Record baseline spend, views, clicks, attributed orders, attributed revenue, product mix, prices, costs, and return maturity for both scenarios. Change one allocation rule or listing set at a time and preserve the prior configuration.
Observe both Ads reporting and settled economics. A rise in attributed ROAS can come from mix, price, attribution maturity, or fewer clicks without proving profit improved. Reconcile target contribution per mature attributed order.
Close when the predeclared comparison window matures and both configuration and economics satisfy acceptance. If either listing breaches its ceiling, roll back its change without treating the other listing's average as a rescue.
Which records support this same-grain scenario comparison?
Use one listing or defensible listing group, one currency, one fee market, and one mature Etsy Ads reporting window. Reconcile item and buyer-paid shipping revenue, product cost, packaging, labor, actual shipping, percentage and fixed fees, expected return loss, Etsy Ads spend, attributed orders, and attributed revenue at the same grain. Views and clicks describe traffic; they are not converted orders.
Keep Etsy Ads and Offsite Ads evidence separate. Etsy Ads charges arise from interactions with ads on Etsy and are visible in the Ads dashboard and Payment account. Offsite Ads applies an attributed-order fee under a different program and current last-click rules. Model an Offsite Ads percentage only as a separate applicable scenario or when the resolved order record supports that path.
Freeze report dates, attribution window, selected listings, currency, fee version, cost version, return-loss method, calculation version, exclusions, and fingerprints. Reperform one public dummy fixture by hand. A matching report does not prove incrementality, and a matching fingerprint proves only that the evidence package did not change.
- Use completed, sufficiently mature attribution windows.
- Separate click spend, attributed revenue, and settled contribution.
- Treat missing cost evidence as unknown rather than zero.
- Record listing-mix and price changes inside the window.
- Recalculate after fee, product, shipping, policy, or attribution changes.
Privacy boundaries for this same-grain scenario comparison
The calculator needs aggregate money values and rates, not buyer identity. Do not paste names, email addresses, postal addresses, order IDs, message text, personalization, payment data, tracking numbers, search histories, or raw order exports into the public tool, an article, analytics events, feedback, email drafts, or community posts.
An operator can reconcile the model privately by listing or cohort using summarized Ads dashboard totals, Payment account totals, cost records, and mature return outcomes. Preserve source files only in the approved private environment, restrict access, follow retention rules, and use non-reversible fingerprints when proving that an evidence package remained unchanged.
Ad search terms, product economics, return rates, conversion performance, and campaign limits can be commercially sensitive even without personal data. Public examples on these pages are fictional and rounded. Seller Profit Guard runs this quick calculation in the browser and does not require Etsy credentials, but the seller remains responsible for secure evidence handling.
How should the calculator be used for this same-grain scenario comparison?
Enter item price plus buyer-paid shipping as modeled revenue. Add product, packaging, labor, actual shipping, combined percentage-fee assumption, fixed payment fee, an optional Offsite Ads scenario, expected return loss per order, planned Etsy Ads spend per converted order, and target margin. Use the exact cost and fee bases that match the selected listing and market.
The tool reports contribution before Etsy Ads, theoretical break-even ad spend, target-safe ad spend, break-even and target ACOS, and reciprocal break-even and target ROAS. The primary card is target-safe spend per converted order. It is not a cost-per-click bid, daily budget recommendation, conversion forecast, or instruction to scale.
Run representative, adverse, and out-of-scope fixtures. Compare the order-level ceiling with actual Etsy Ads spend divided by mature attributed orders, then reconcile attributed revenue with settled order economics. Record source uncertainty and stop conditions. Do not infer that attributed orders are incremental or that a profitable average makes every advertised listing safe.
- Choose one listing cohort and mature reporting window.
- Reconcile revenue, non-ad costs, and expected return loss.
- Calculate break-even and target-safe order-level ad room.
- Compare with Ads spend, attributed orders, ACOS, and ROAS.
- Record a bounded continue, hold, reduce, test, or stop decision.
Sources and further reading
- Etsy Advertising & Marketing Policy: Current Etsy Ads budget, click-charge, reporting, last-click, and Offsite Ads participation rules; updated June 8, 2026.
- Etsy Help: Review Etsy Ads performance: Official definitions for views, clicks, attributed orders, revenue, budget spent, ROAS, search terms, and the 30-day attribution window.
- Etsy Help: How Ads Are Placed in Etsy Search: Official explanation of Etsy Ads placement, listing quality, competition, and cost-per-click behavior.
- Etsy Fees & Payments Policy: Current seller-fee, Etsy Ads, Offsite Ads, payment, currency, and region-specific fee boundaries.
- Etsy Help: How Etsy's Offsite Ads Work: Official Offsite Ads attribution, fee-rate, enrollment, order-cap, and dashboard guidance.
- Seller Profit Guard calculation methodology: Definitions for contribution, editable assumptions, evidence hierarchy, local-first privacy, uncertainty, and non-advice limits.
Related Seller Profit Guard tools
- Open the Etsy Ads Break-Even Calculator: Calculate order-level ad room, break-even and target ACOS, and break-even and target ROAS.
- Read the nine-cost break-even ROAS guide: Use the broader cross-platform model when affiliate, app, discount, and return-severity layers must be separated.
- Review Etsy Offsite Ads profit examples: Keep Etsy Ads click spend separate from attributed-order Offsite Ads fees.
- Estimate return-window loss: Build the expected return-loss input from frequency and incident severity.
- Use the Etsy profit calculator: Reconcile actual revenue, costs, fees, advertising, returns, and retained contribution.
- Read the local-first methodology: Understand evidence, privacy, formula scope, and interpretation boundaries.
- Etsy Ads Break-Even Formula: 12 Inputs: Continue the Etsy Ads evidence, calculation, and campaign-control workflow.
- Etsy Ads Break-Even Example: Low-Cost Item: Continue the Etsy Ads evidence, calculation, and campaign-control workflow.
- Etsy Ads Break-Even for a High-Return Item: Continue the Etsy Ads evidence, calculation, and campaign-control workflow.
- Etsy Ads Break-Even: 12 Costly Mistakes: Continue the Etsy Ads evidence, calculation, and campaign-control workflow.
- Etsy Ads Break-Even Data: Source Map: Continue the Etsy Ads evidence, calculation, and campaign-control workflow.
Next step: Open the Etsy Ads Break-Even Calculator.
This is operational planning help, not tax, accounting, legal, financial, or platform-policy advice. Review the Terms and disclaimer, and verify current platform rules and fee assumptions before changing prices.