Weekly versus monthly Etsy deposit fee scenarios
Last updated: 2026-07-30
Written and reviewed by Seller Profit Guard Editorial Team.
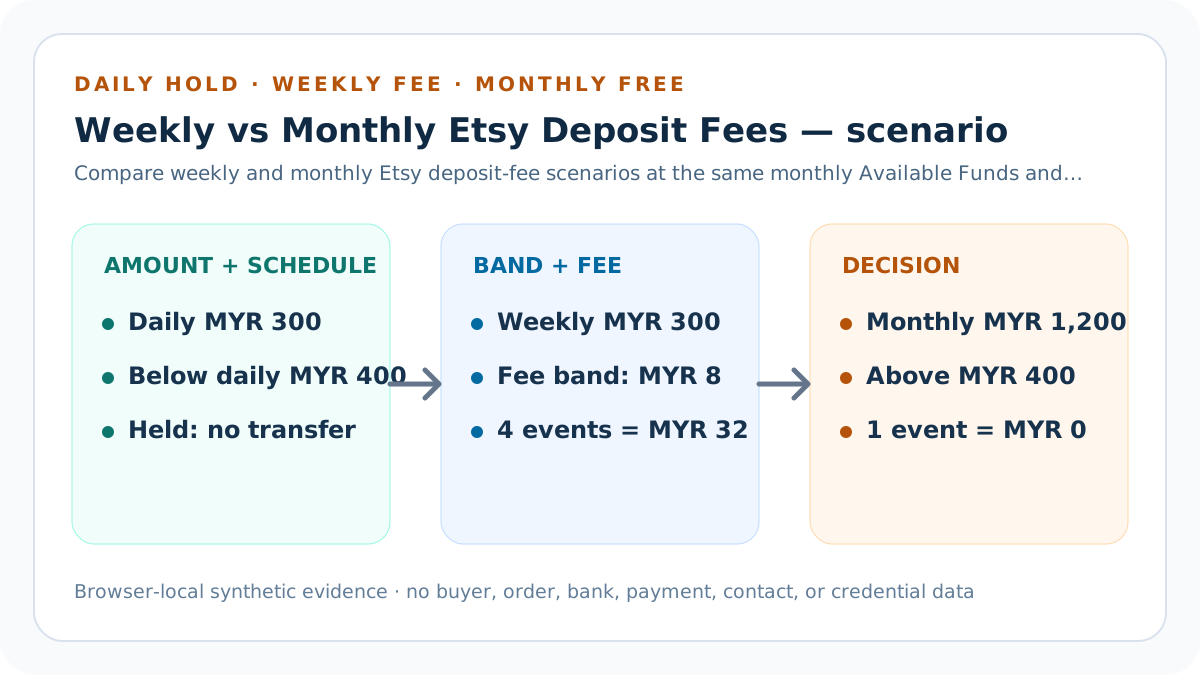
At MYR 1,200 monthly Available Funds, four weekly MYR 300 events create MYR 32 modeled fees. One monthly MYR 1,200 event clears the MYR 400 threshold and creates no modeled fee. A daily MYR 300 amount is held below the daily threshold rather than sent with a fee.
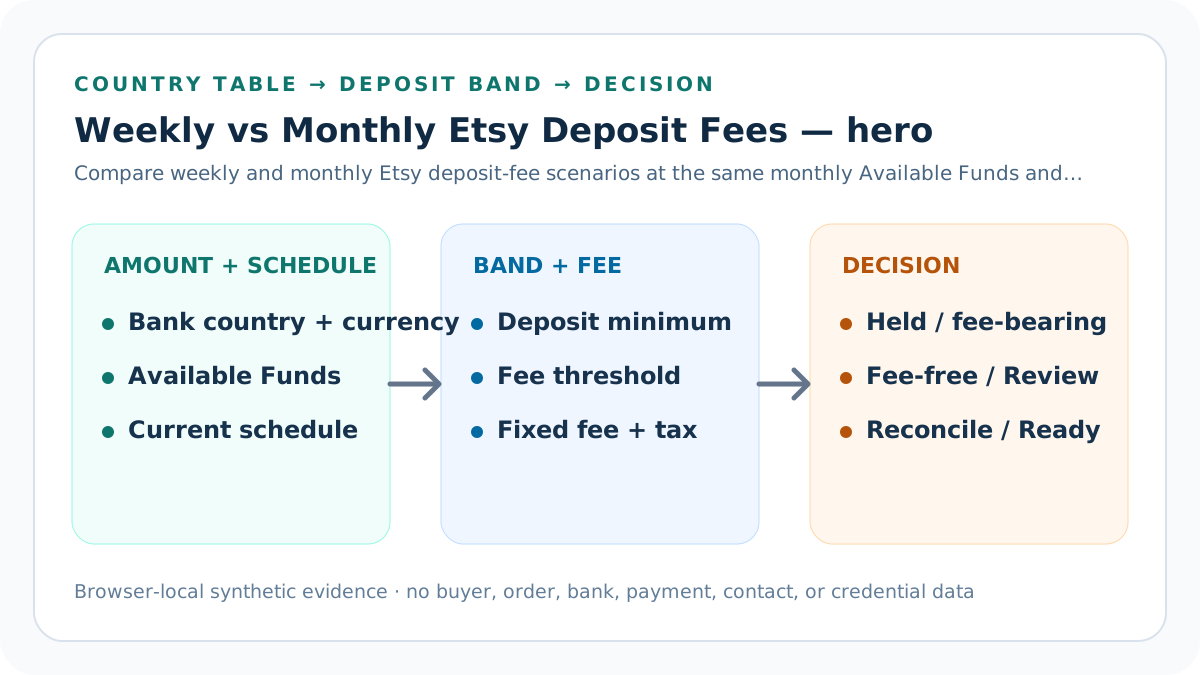
scenario comparability: scope and direct answer
This guide addresses a transparent frequency-driven fee difference for one Etsy Payments evidence period. It begins with bank country, currency, current public table, Available Funds, schedule, actual fee rows, and declared conflicts rather than a preferred cash-flow outcome.
The calculator is browser-local and uses synthetic examples. It does not retrieve Etsy or bank data, authenticate a seller, guarantee a payment date, value cash timing, or change a deposit schedule.
Build the same-grain deposit schedule matrix
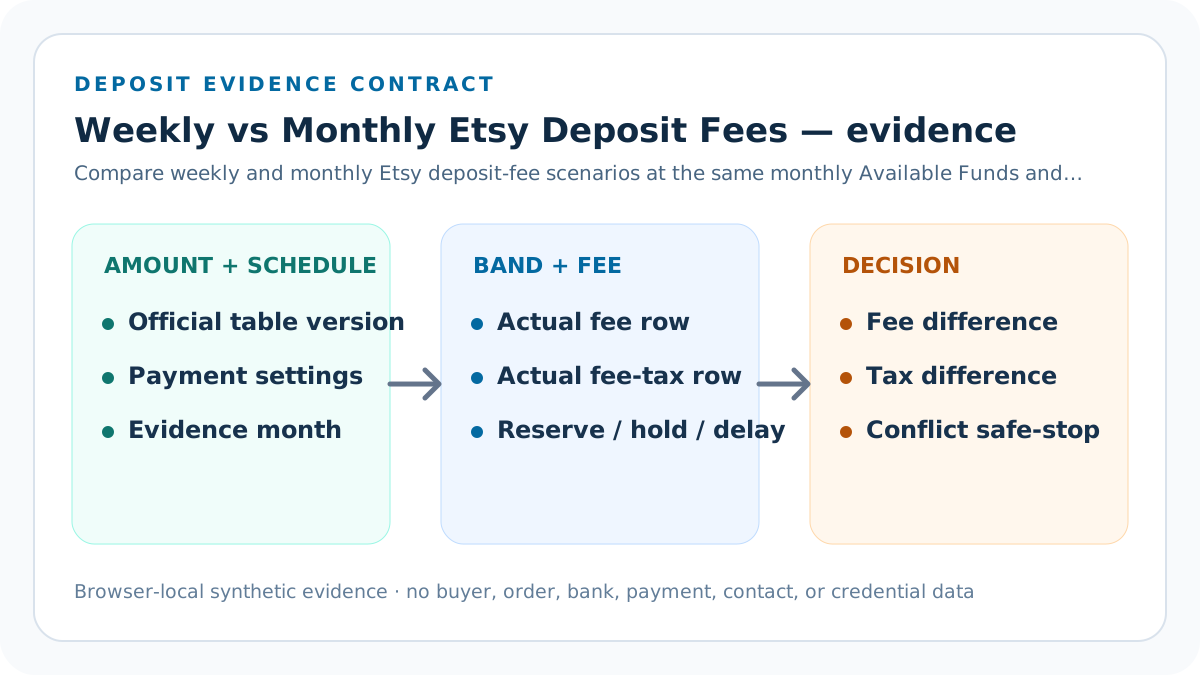
The contract stores country, currency, period, Available Funds per event, deposit minimum, fee threshold, fixed fee, fee-tax rate, actual fee and tax, tolerance, current and comparison schedules, event counts, monthly ceiling, and known evidence issues.
Decision precedence is Block, Reconcile, Hold, Review, then Ready. A favorable comparison cannot compensate for a wrong country table, unknown account condition, actual-row difference, or declared reserve, hold, delay, refund, currency, or statement conflict.
Align monthly Available Funds
Use the same MYR 1,200 modeled total for weekly and monthly columns.
Use identical matrix columns and label the single changed variable before comparing deposit frequencies. Matrix row 1 freezes the country, currency, table version, tax rate, monthly MYR 1,200 total, and evidence period, then changes only modeled deposit frequency. Show the weekly and monthly value side by side, calculate the isolated delta, and separately preserve the daily hold rule.
The comparison test changes event count from 20 to four while preserving modeled monthly funds, then recomputes amount per event, band, per-event cost, monthly exposure, and difference. A second test introduces one unequal-month variable and must reject the comparison until both columns share the same grain and documented exclusions.
Align country and currency
Keep Malaysia, MYR, current table values, tax rate, period, and evidence source unchanged.
Use identical matrix columns and label the single changed variable before comparing deposit frequencies. Matrix row 2 freezes the country, currency, table version, tax rate, monthly MYR 1,200 total, and evidence period, then changes only modeled deposit frequency. Show the weekly and monthly value side by side, calculate the isolated delta, and separately preserve the daily hold rule.
The comparison test changes event count from 20 to four while preserving modeled monthly funds, then recomputes amount per event, band, per-event cost, monthly exposure, and difference. A second test introduces one unequal-month variable and must reject the comparison until both columns share the same grain and documented exclusions.
Calculate weekly average funds
MYR 1,200 divided by four creates MYR 300 per modeled event.
Use identical matrix columns and label the single changed variable before comparing deposit frequencies. Matrix row 3 freezes the country, currency, table version, tax rate, monthly MYR 1,200 total, and evidence period, then changes only modeled deposit frequency. Show the weekly and monthly value side by side, calculate the isolated delta, and separately preserve the daily hold rule.
The comparison test changes event count from 20 to four while preserving modeled monthly funds, then recomputes amount per event, band, per-event cost, monthly exposure, and difference. A second test introduces one unequal-month variable and must reject the comparison until both columns share the same grain and documented exclusions.
Classify weekly fee exposure
A weekly MYR 300 event falls above the MYR 9 minimum and below the MYR 400 threshold, producing MYR 8 each.
Use identical matrix columns and label the single changed variable before comparing deposit frequencies. Matrix row 4 freezes the country, currency, table version, tax rate, monthly MYR 1,200 total, and evidence period, then changes only modeled deposit frequency. Show the weekly and monthly value side by side, calculate the isolated delta, and separately preserve the daily hold rule.
The comparison test changes event count from 20 to four while preserving modeled monthly funds, then recomputes amount per event, band, per-event cost, monthly exposure, and difference. A second test introduces one unequal-month variable and must reject the comparison until both columns share the same grain and documented exclusions.
Calculate the monthly amount
One monthly event uses the full MYR 1,200 modeled amount.
Use identical matrix columns and label the single changed variable before comparing deposit frequencies. Matrix row 5 freezes the country, currency, table version, tax rate, monthly MYR 1,200 total, and evidence period, then changes only modeled deposit frequency. Show the weekly and monthly value side by side, calculate the isolated delta, and separately preserve the daily hold rule.
The comparison test changes event count from 20 to four while preserving modeled monthly funds, then recomputes amount per event, band, per-event cost, monthly exposure, and difference. A second test introduces one unequal-month variable and must reject the comparison until both columns share the same grain and documented exclusions.
Classify monthly fee exposure
MYR 1,200 exceeds the threshold, producing no modeled fixed deposit fee.
Use identical matrix columns and label the single changed variable before comparing deposit frequencies. Matrix row 6 freezes the country, currency, table version, tax rate, monthly MYR 1,200 total, and evidence period, then changes only modeled deposit frequency. Show the weekly and monthly value side by side, calculate the isolated delta, and separately preserve the daily hold rule.
The comparison test changes event count from 20 to four while preserving modeled monthly funds, then recomputes amount per event, band, per-event cost, monthly exposure, and difference. A second test introduces one unequal-month variable and must reject the comparison until both columns share the same grain and documented exclusions.
Identify the driver
The difference comes from modeled frequency and amount per event, not a change in country fee table or monthly funds.
Use identical matrix columns and label the single changed variable before comparing deposit frequencies. Matrix row 7 freezes the country, currency, table version, tax rate, monthly MYR 1,200 total, and evidence period, then changes only modeled deposit frequency. Show the weekly and monthly value side by side, calculate the isolated delta, and separately preserve the daily hold rule.
The comparison test changes event count from 20 to four while preserving modeled monthly funds, then recomputes amount per event, band, per-event cost, monthly exposure, and difference. A second test introduces one unequal-month variable and must reject the comparison until both columns share the same grain and documented exclusions.
Apply the daily guardrail separately
Do not turn the weekly MYR 300 fee-bearing row into a daily row: the daily MYR 400 threshold prevents that transfer in this fixture.
Use identical matrix columns and label the single changed variable before comparing deposit frequencies. Matrix row 8 freezes the country, currency, table version, tax rate, monthly MYR 1,200 total, and evidence period, then changes only modeled deposit frequency. Show the weekly and monthly value side by side, calculate the isolated delta, and separately preserve the daily hold rule.
The comparison test changes event count from 20 to four while preserving modeled monthly funds, then recomputes amount per event, band, per-event cost, monthly exposure, and difference. A second test introduces one unequal-month variable and must reject the comparison until both columns share the same grain and documented exclusions.
Distinguish eligibility from economics
Weekly and monthly rows compare fee economics only after each schedule is eligible; the daily row demonstrates that eligibility has precedence over fee arithmetic.
Use identical matrix columns and label the single changed variable before comparing deposit frequencies. Matrix row 9 freezes the country, currency, table version, tax rate, monthly MYR 1,200 total, and evidence period, then changes only modeled deposit frequency. Show the weekly and monthly value side by side, calculate the isolated delta, and separately preserve the daily hold rule.
The comparison test changes event count from 20 to four while preserving modeled monthly funds, then recomputes amount per event, band, per-event cost, monthly exposure, and difference. A second test introduces one unequal-month variable and must reject the comparison until both columns share the same grain and documented exclusions.
State excluded timing risks
Actual availability, reserve, hold, delay, refund, weekend, holiday, and bank processing remain outside the comparison.
Use identical matrix columns and label the single changed variable before comparing deposit frequencies. Matrix row 10 freezes the country, currency, table version, tax rate, monthly MYR 1,200 total, and evidence period, then changes only modeled deposit frequency. Show the weekly and monthly value side by side, calculate the isolated delta, and separately preserve the daily hold rule.
The comparison test changes event count from 20 to four while preserving modeled monthly funds, then recomputes amount per event, band, per-event cost, monthly exposure, and difference. A second test introduces one unequal-month variable and must reject the comparison until both columns share the same grain and documented exclusions.
Verification, release, and deposit feedback
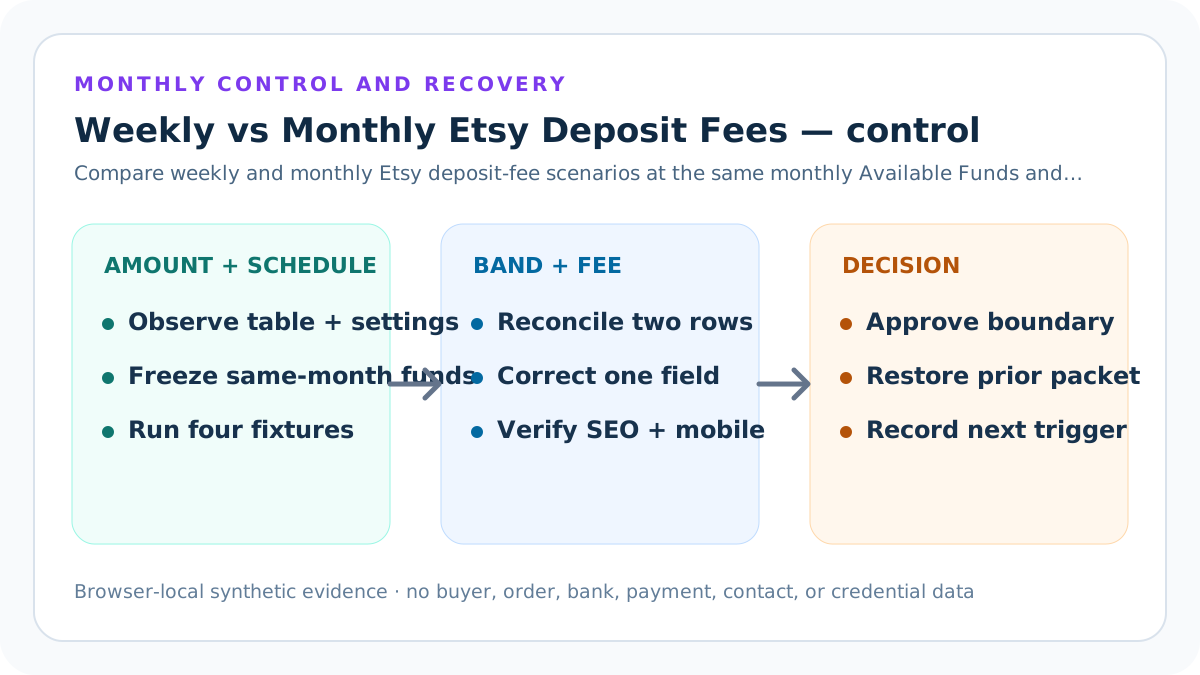
Before changing schedule guidance, fee-stack values, public routes, or calculator defaults, preserve the same-grain deposit schedule matrix, current official sources, private evidence pointers, inputs, expected fixtures, tests, build output, route inventory, release manifest, and rollback identifier. Safe-stop on an unexpected account, warning, authentication challenge, or target context.
Require valid YYYY-MM-DD source and Available Funds dates, with the source review on or after the funds evidence; explicit yes confirmations for bank country, table row, Available Funds, schedules, account constraints, and actual rows; the exact scope “One scheduled Etsy Payments deposit”; and finite nonnegative amounts and tolerance. After a bounded correction, rerun MYR 300 Available Funds, MYR 9 minimum, MYR 400 fee and daily threshold, MYR 8 fee, and four modeled weekly deposits, the same MYR 1,200 monthly Available Funds in one MYR 1,200 monthly deposit, a daily MYR 300 amount held below Malaysia's MYR 400 daily threshold, MYR 9 Available Funds at the entered MYR 9 minimum, ZAR 1,000 Available Funds, ZAR 35 minimum, ZAR 1,500 threshold, ZAR 30 fee, and separately entered fee tax, and invalid dates, incomplete confirmations, a wrong evidence scope, negative rows, malformed currency, or a mismatched country table. Inspect exact amounts, band, fee, tax, net bank deposit, separate differences, monthly exposure, comparison, mobile layout, canonical, schema, sources, original visuals, internal links, and indexability.
Limits, privacy boundary, and next action
This guide and calculator do not reproduce every daily minimum, reserve, hold, delay, bank change, refund, holiday, instant transfer, Payoneer rule, tax, or future policy. They do not prove payout, bank receipt, liquidity, tax liability, accounting profit, ranking, traffic, qualified intent, AdSense approval, revenue, or income.
Keep buyer names, emails, addresses, messages, order and listing IDs, bank details, payment rows, tax identifiers, account notices, contacts, tokens, OAuth material, credentials, and raw exports outside the same-grain deposit schedule matrix. Verify current Etsy settings and actual statements, then obtain qualified accounting, tax, legal, or cash-management advice when material.
Sources and further reading
- Etsy Help: Receive Your Etsy Payments Deposit: Reviewed 2026-07-30: current schedules plus the nine-country daily threshold, additional minimum, fee-threshold, and fixed deposit-fee table.
- Etsy Payments Policy: Reviewed 2026-07-30: Available Funds, scheduled deposits, fee deduction, VAT boundary, returned-deposit refund, reserves, holds, and delays.
- Etsy Help: Fees and Taxes for Selling: Reviewed 2026-07-30: deposit-fee applicability in certain countries and the above-minimum, below-threshold band.
- Etsy Help: Calculate Your Etsy Payments Deposit: Available deposit amount, monthly statement evidence, fees, taxes, refunds, and activity since the prior deposit.
- Etsy Help: What Is Etsy Payments?: Etsy Payments eligibility plus additional minimum, threshold, and fee concepts in supported markets.
- Seller Profit Guard methodology: Evidence precedence, browser-local synthetic fixtures, privacy boundaries, deterministic decisions, validation, release, correction, and rollback.
Related Seller Profit Guard tools
- Open the Etsy Deposit Fee Calculator: Classify one scheduled deposit and compare monthly fee exposure with a less frequent schedule.
- Reconcile the Payment account: Compare expected deposit-fee and tax rows with actual statement activity.
- Calculate an Etsy Payments deposit: Trace sales, refunds, fees, taxes, reserves, holds, and available funds.
- Build the complete Etsy fee stack: Carry reconciled deposit fees into the wider seller-cost model without double counting.
- Run Seller Profit Guard: Combine the reconciled fee stack with direct costs, returns, and target contribution.
- Read the local-first methodology: Keep buyer, order, bank, tax, contact, credential, and raw export data outside public pages.
- Etsy Deposit Fee Formula and Inputs: Continue the formula, example, source, threshold, comparison, routine, interpretation, or audit workflow.
- Malaysia Etsy Deposit Fee Worked Example: Continue the formula, example, source, threshold, comparison, routine, interpretation, or audit workflow.
- Monthly Etsy Deposit Fee Scenario: Continue the formula, example, source, threshold, comparison, routine, interpretation, or audit workflow.
- 12 Etsy Deposit Fee Errors and Fixes: Continue the formula, example, source, threshold, comparison, routine, interpretation, or audit workflow.
- Etsy Deposit Fee Evidence Sources: Continue the formula, example, source, threshold, comparison, routine, interpretation, or audit workflow.
Next step: Open the Etsy Deposit Fee Calculator.
This is operational planning help, not tax, accounting, legal, financial, or platform-policy advice. Review the Terms and disclaimer, and verify current platform rules and fee assumptions before changing prices.